Home ← Live Mathematics and STEM on the Web ← My First Web Page: Creating Beautiful Mathematics ← Geometry Expressions Showcase: Learn How: GXWeb
Learn How: Create your own Interactive GXWeb Task
Create Your Own Live Mathematics and STEM Web Pages
W3Schools.com: Taking Your Web Page Skills to the Next Level
Saltire Software, home of Geometry Expressions and GXWeb
GXWeb Math Explorer: What is Possible with GXWeb
Learn How: Create Your Own GX Assessment Task
Learn How 2: Take GXWeb to the Next Level!
Introduction
GXWeb is an extraordinary software tool which offers many of the wonderful features of Geometry Expressions free of charge - and it is available on every platform. Necessarily more limited than its commercial siblings, it nonetheless captures the essence of the constraint-based blend of dynamic geometry and computer algebra that defines this system.
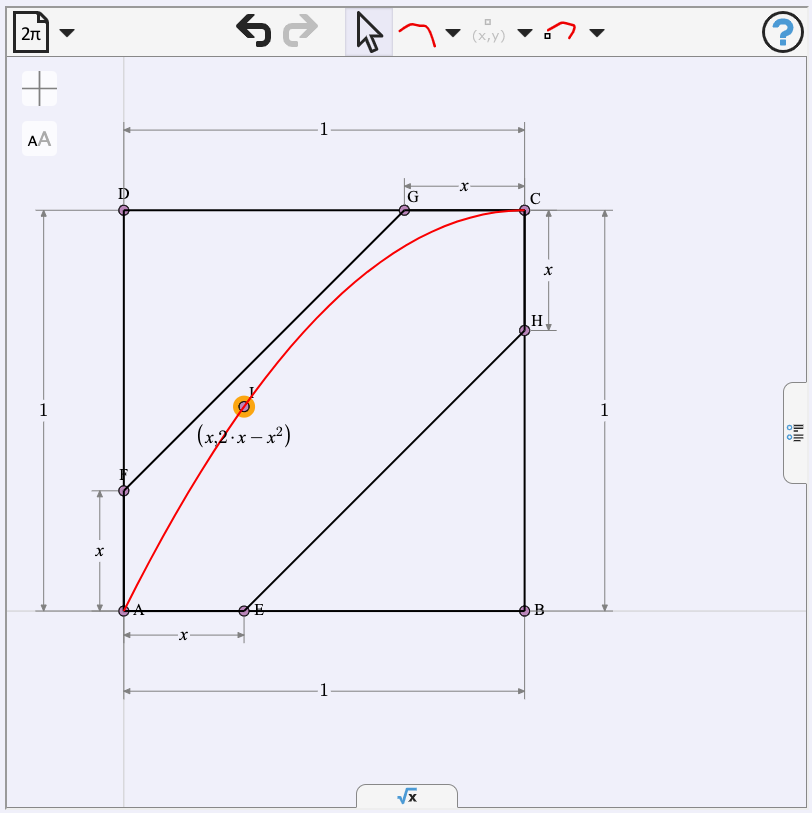
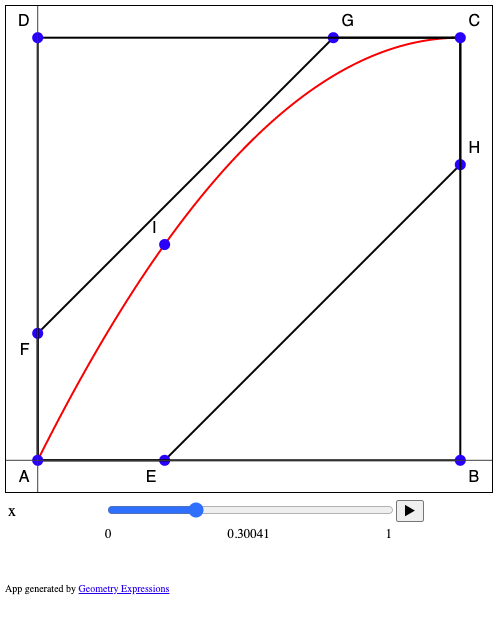
While not offering the facility to save and revisit one's creations, the latest version of GXWeb does offer a surprisingly powerful feature - it supports the generation of HTML5/JavaScript web apps, just as Geometry Expressions (GX) does! Tap on the first image opposite to see this in action.
From...
to...
... and even to...
These apps are generally much simpler than those created in GX (although much more is possible than you might expect!), and so they may serve as powerful tools for teaching and learning - especially when they can be enhanced in the same way as Geometry Expressions (GX) apps, described previously.
As before, we will consider four stages in opening up your embedded GXWeb applet:
Creating your GXWeb applet
Writing TO the applet
Reading FROM the applet
Putting it all together
Stage 1: Build Your GXWeb Applet
The sample used in the following step-by-step process is the (relatively simple) Meeting a Friend task.
Step 1.1
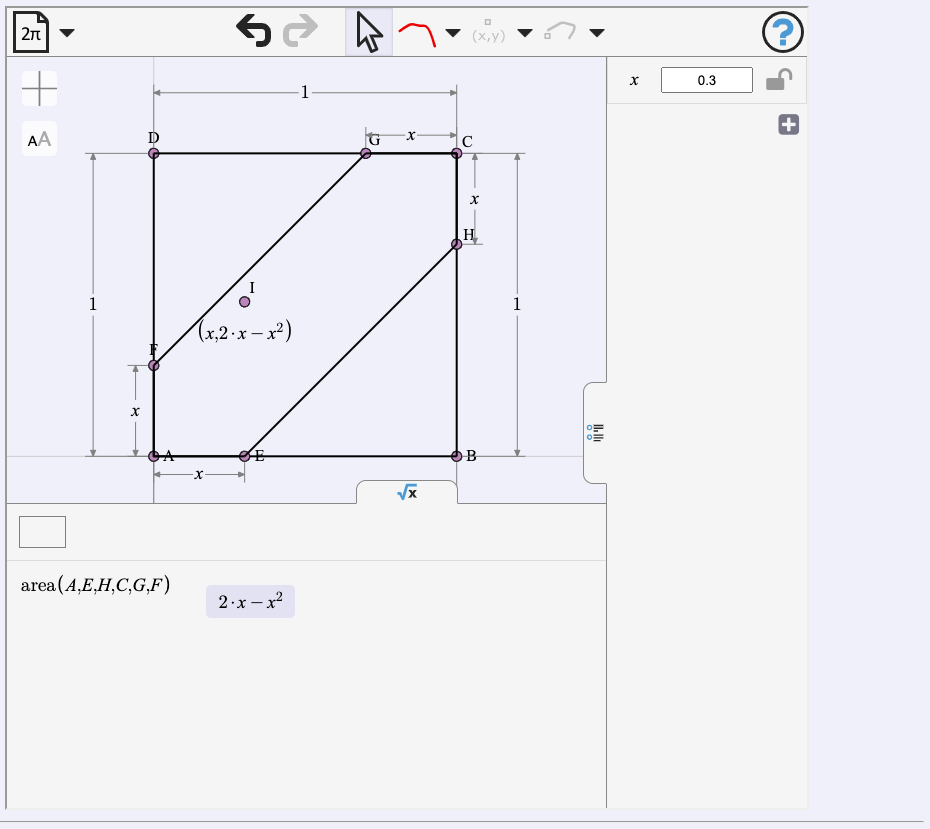
Create a GXWeb model for your task. Usually, it will have at least one "driver point" (generally labelled "x") corresponding in this case to the constrained length of a segment on the x-axis. There may also be some output value - in this case, the area of the polygon. Unlike GX web apps, however, outputs will NOT appear in the resulting document.
GXWeb Pro-Tip #1: Using a constrained segment length (as x is used here) will give you a slider. However, other values (such as the measured or calculated values, like area will not appear in your App).
Step 1.2
When you are satisfied with your model, press down on some unmarked screen area, and choose either Save App (which will download an HTML text file) or Copy App (which will copy the document code to the Clipboard for pasting).
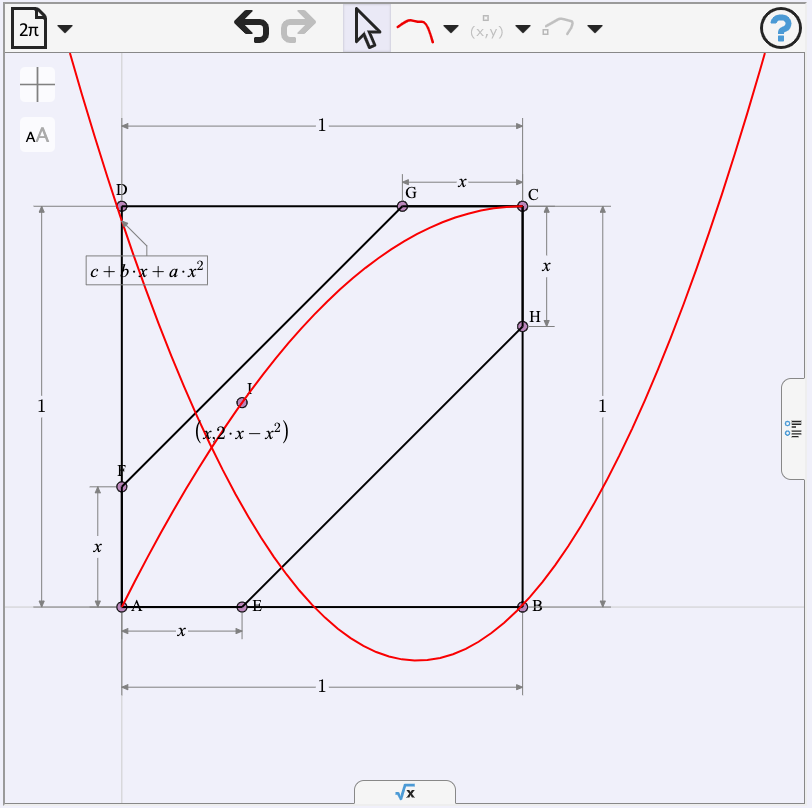
GXWeb Pro-Tip #2: Draw a graph in GXWeb, accepting the defaults (such as c + b*x + a*x2) and these will also appear in your App as sliders!
Step 1.3
The output will be an HTML file. It will work very well in this form, but for our purposes we will use a text editor to open this document and take it apart.
At this point, you might be interested to have a look (and a play if you like) with the actual code that GXWeb exports to make this applet. Be warned - it is VERY long, but you will notice that there are three sections:
First, down to the <script type="text/javascript"> tag you will see the initial HTML code for the HEAD of the web page - here you will see mainly style commands which determine the appearance of the page elements.
Next - and this is the long part - the JavaScript code which makes all the magic happen!
Finally the last section of perhaps 50 lines is the HTML code which lays out the elements of the page.
Stage 2: Writing TO your GX Applet
Exactly as with Geometry Expressions, adding the ability to write to your embedded applet is very straightforward: go to two lines before the end of the code (between </div></div> and </body></html>) and insert the following:
<P><input id="xval" type="text" onchange="setGX();" style="font-size : 24px; width: 50%; height: 50px; color:blue; background:white;" size="20" value="0.3"></P>
Area AEHCGF = <span ID="area" style="font-size : 24px;">0</span>
<script>
function setGX() {
var x = document.getElementById('xval').value; document.getElementById('UIx').value = x; document.getElementById('UIINUIx').textContent = x;
document.getElementById("area").innerHTML = eval(eval(2*x-x*x).toFixed(2));
onTime();
}
</script>
The first paragraph adds a text box (called "xval") for inputting values for x. The initial value is set as 0.3.
The next paragraph creates a section (DIVision) into which text can be inserted.
The script does the work, defining a function, setGX(), which defines a variable for the value of the textbox, and then assigns that value to both the slider ("UIx") and the label for x, ("UIINUIx"). When doing this yourself, look for these names in the last section of the web page code, where the components that you see on the page are defined.
The onTime() function serves to literally do a full update of the applet, resetting to the new value for x. The output value for the area is calculated and displayed.
NOTE the "double eval"? The inner one fixes the value to, in this case, 2 decimal places (eg 0.25 or perhaps 0.50). The outer eval takes a result like the last one (0.50) and evaluates it again, presenting it as the preferred value of 0.5.
The use of a text box for input is arbitrary - any type of input will work - even sensor readings from a mobile device!
Stage 3: Reading FROM your GX Applet
Again, in the same way as GX, setting up to read FROM your applet is also very straight forward.
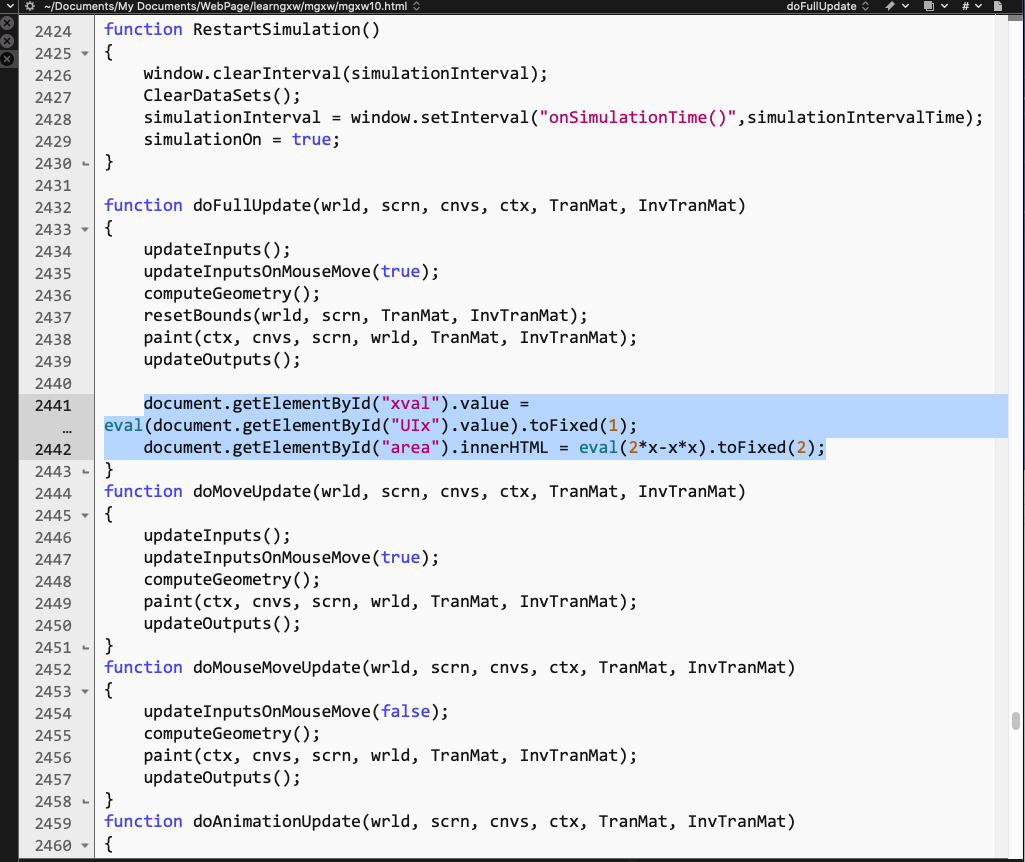
You need to make one change to the document's main script code. As shown, search for the term "function doFullUpdate". Enter the following text at the end of this function (directly after "updateOutputs();"). Feel free to copy and paste from this page - if typing, note that JavaScript code IS case-sensitive!
document.getElementById("xval").value = eval(eval(document.getElementById("UIx").value).toFixed(1)); document.getElementById("area").innerHTML = eval(eval(2*x-x*x).toFixed(2));
Try changing the slider now and see those changes reflected in the text box value.
Stage 4: Putting it All Together
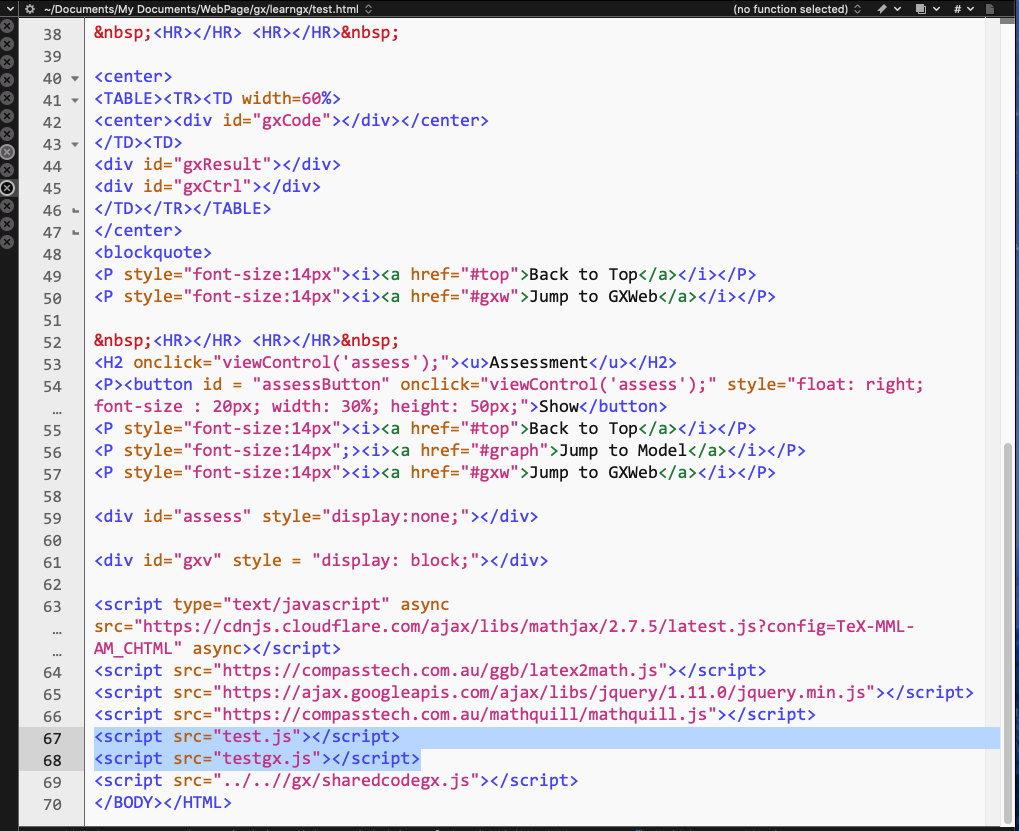
Studying the samples provided in the GX Showcase, you should have observed that each task is broken into four component files:
test.html: The base HTML document which is essentially a template easily used for multiple activities. This is the editable text box document in the GX Showcase. Editing of this document should be minimal.
testgx.js: The JavaScript code for the GX web applet. As described below, the only editing here is the addition of two lines of code.
test.js: The JavaScript code for the context specific elements - the title, introductory text and assessment questions.
Step 4.1
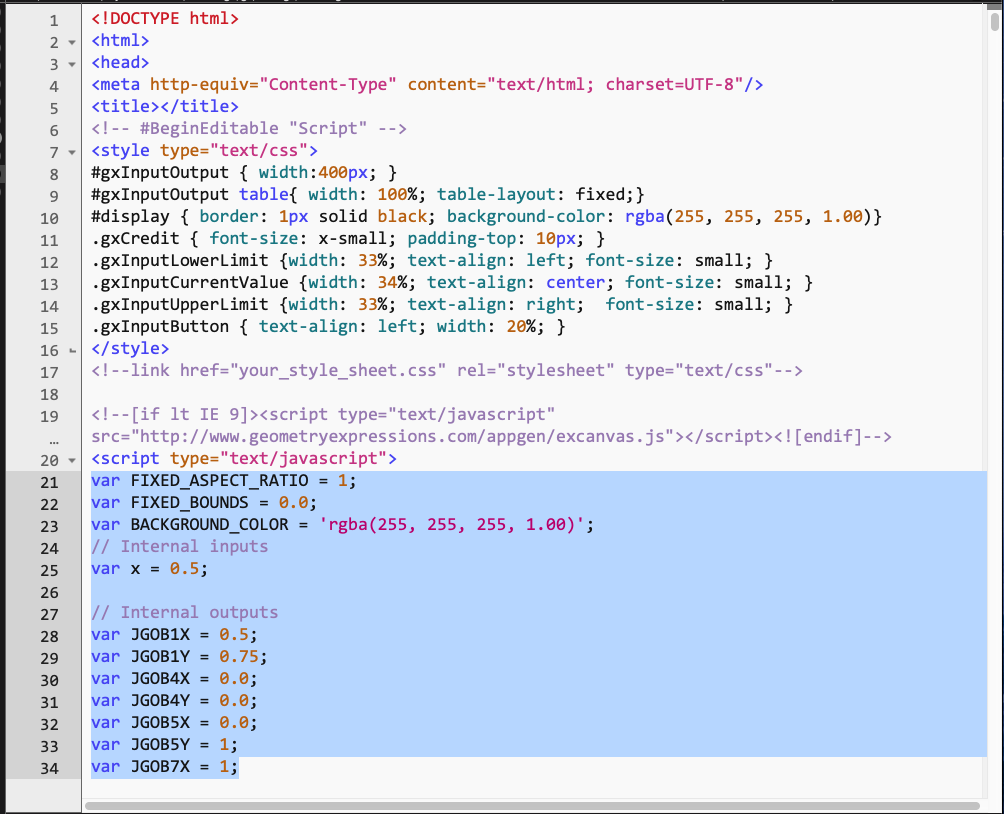
In the first few lines of the HTML code, you will find the beginning of the JavaScript which creates the applet. Look for the <script type="text/javascript"> line which opens the script.
As shown, select from the next line - var FIXED_ASPECT_RATIO = 1;
Step 4.2
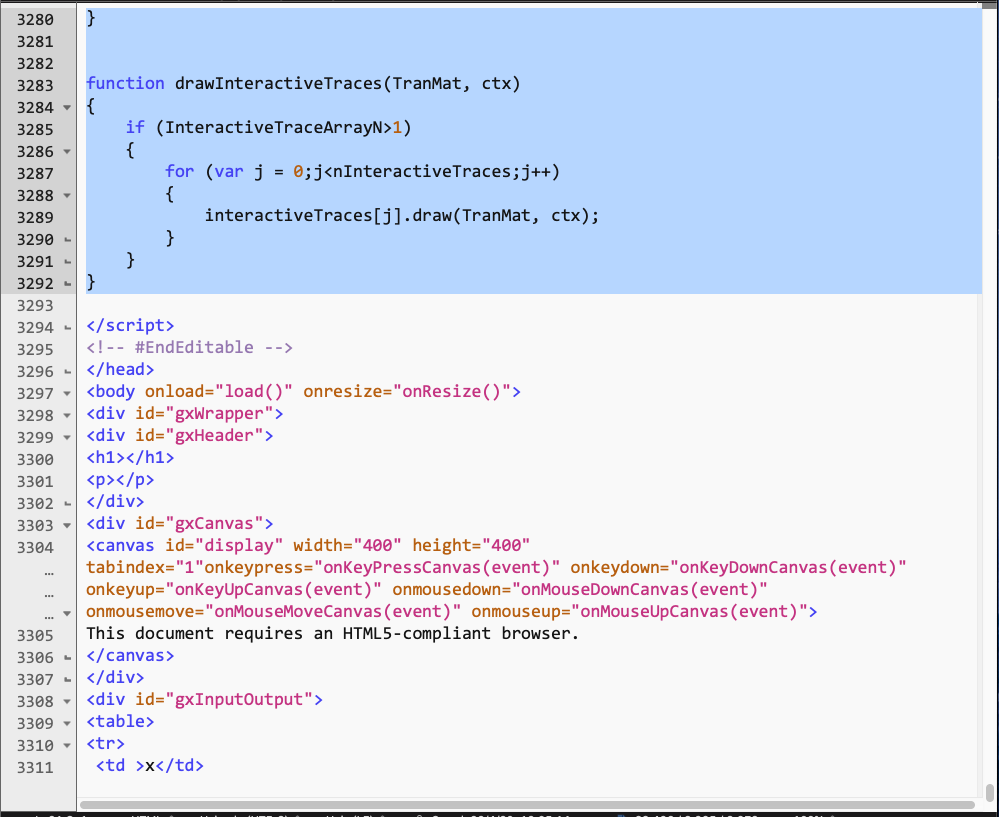
Drag to select almost to the very end of this document (some 3000 lines!) until you reach the closing script command - </script>.
Now COPY the selection, create a new text document, and PASTE. SAVE this document as testgx.js. (Feel free to replace the word "test" with your own task name when doing this yourself).
Step 4.3
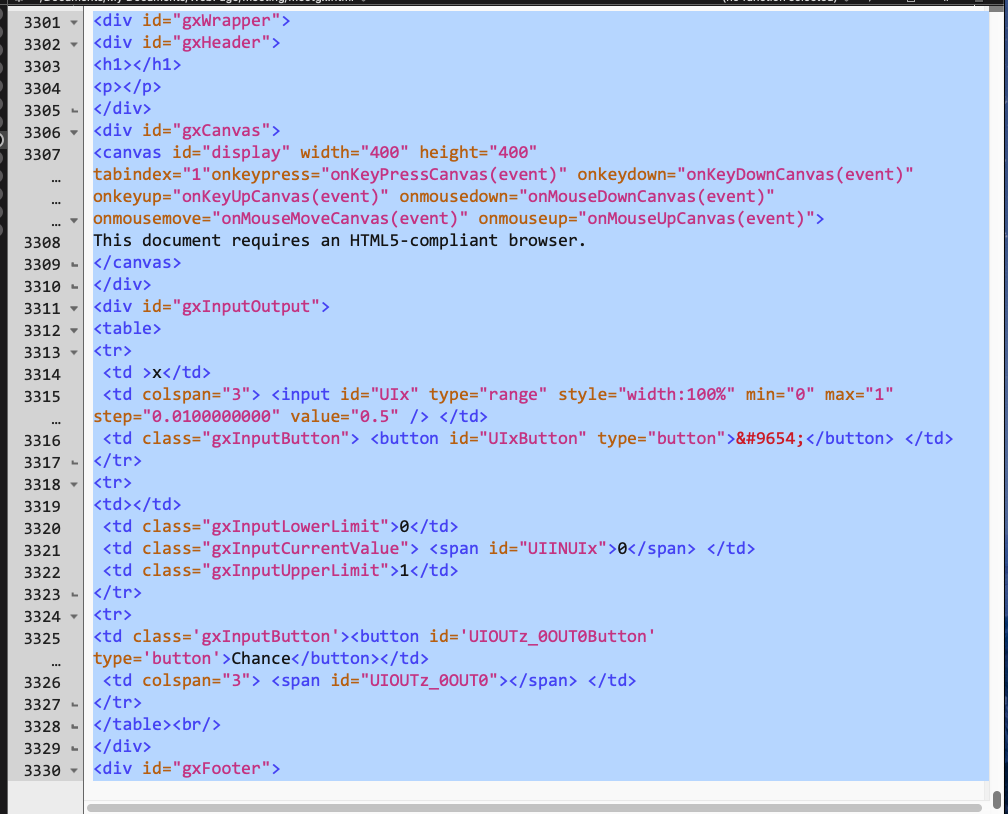
Back to the original HTML document. Find the end of the script that you just copied from this document (look for </script>). Three lines later, you will find <div id="gxWrapper">.
COPY the text from this line down to
</div></div>
just before </body>.
This code is the visible HTML code which displays our model.
Step 4.4
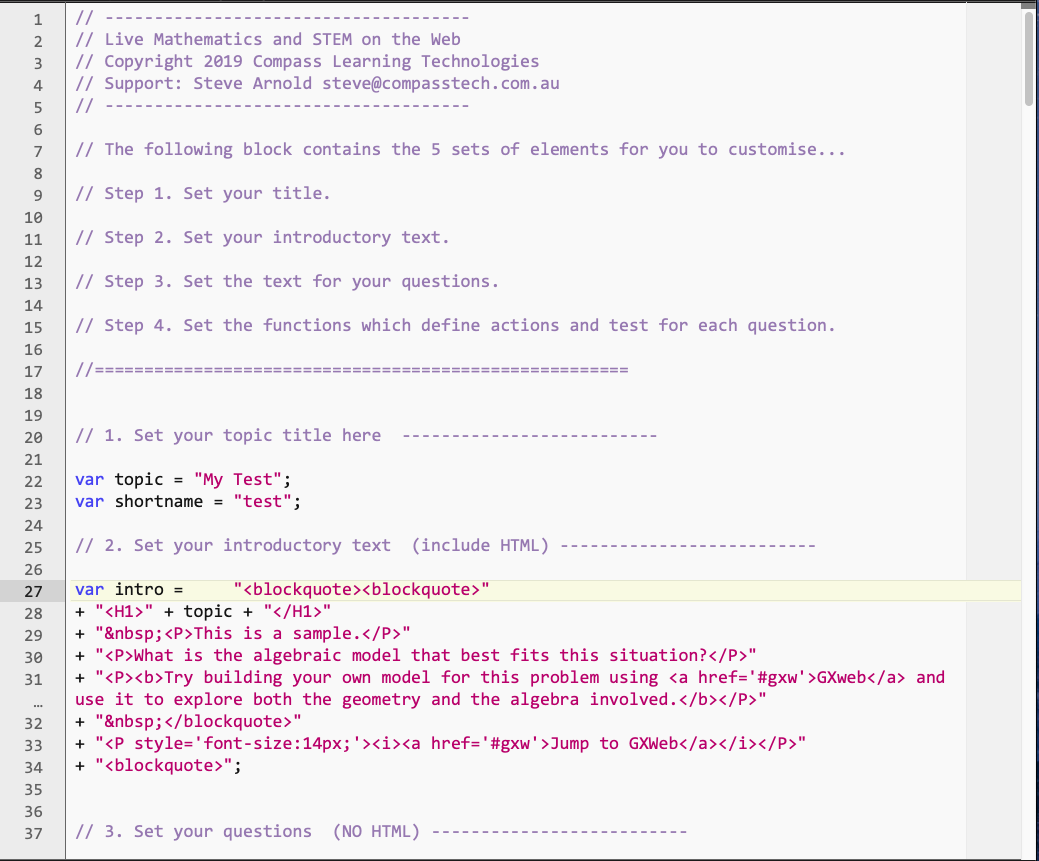
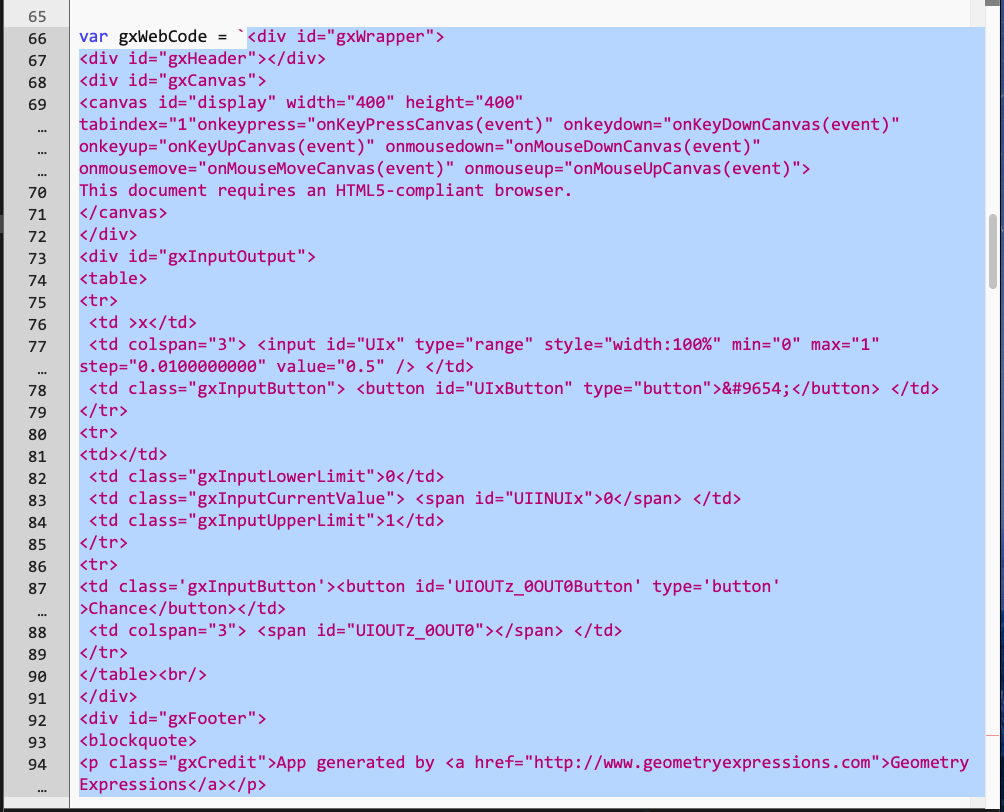
You will paste this HTML code into the "test.js" document (as var gxWebCode), which contains all the specific information for your particular task - the introductory text, the questions and the GX model. Feel free to change the text in this file for your purposes - topic, shortname, intro text...
Step 4.5
Scroll down until you find var gxWebCode and PASTE your text in place of that shown. Make sure that your text begins and ends with a backtick (`) as shown.
Step 4.6
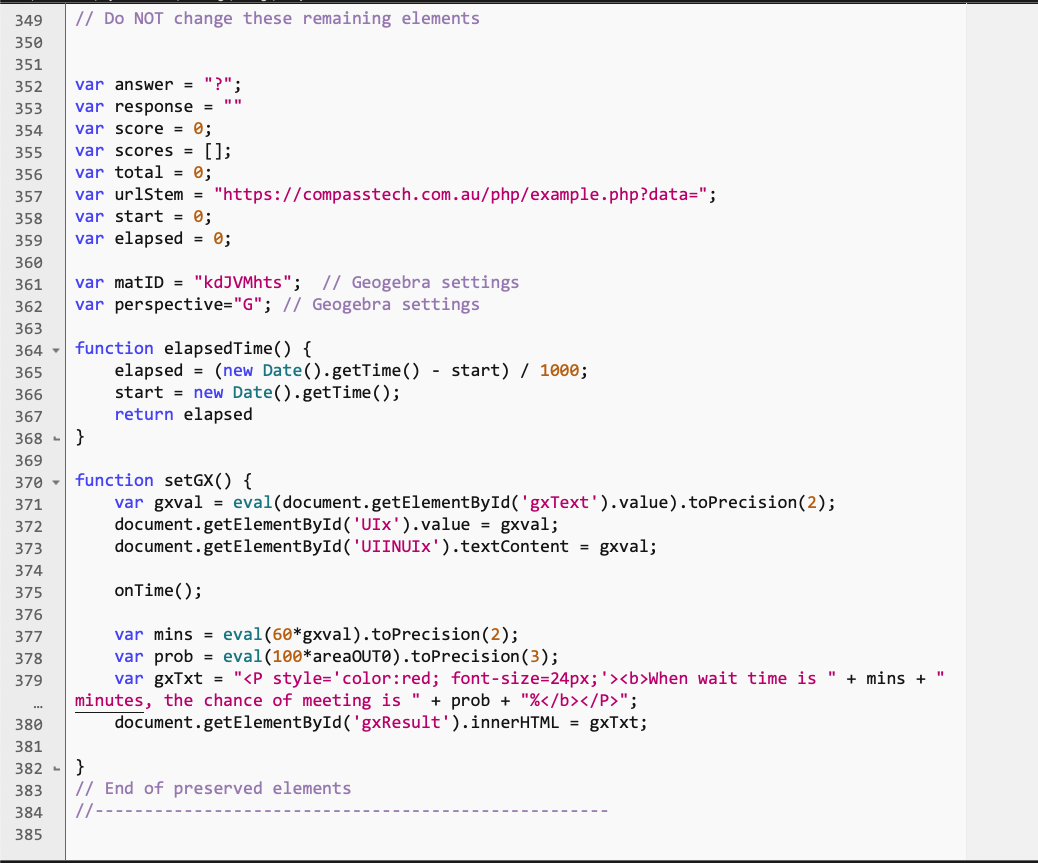
At the end of this document, you will find the important setGX() function, which will also need to be updated to use your variables. The first section should work in most cases where your variable is "x". The second half will depend on what you are doing with "x" and what output you are displaying.
If you plan to create an online assessment task similar to what I have done, you should now work your way through this document, inserting YOUR text and your questions. Obviously, you will need to make changes to the calculations and variables that you will be using. You have multiple models provided here, so feel free to study these and reuse what is relevant.
If you are new to HTML and JavaScript, then feel free to drop me an email and I will help if I can.
Step 4.7
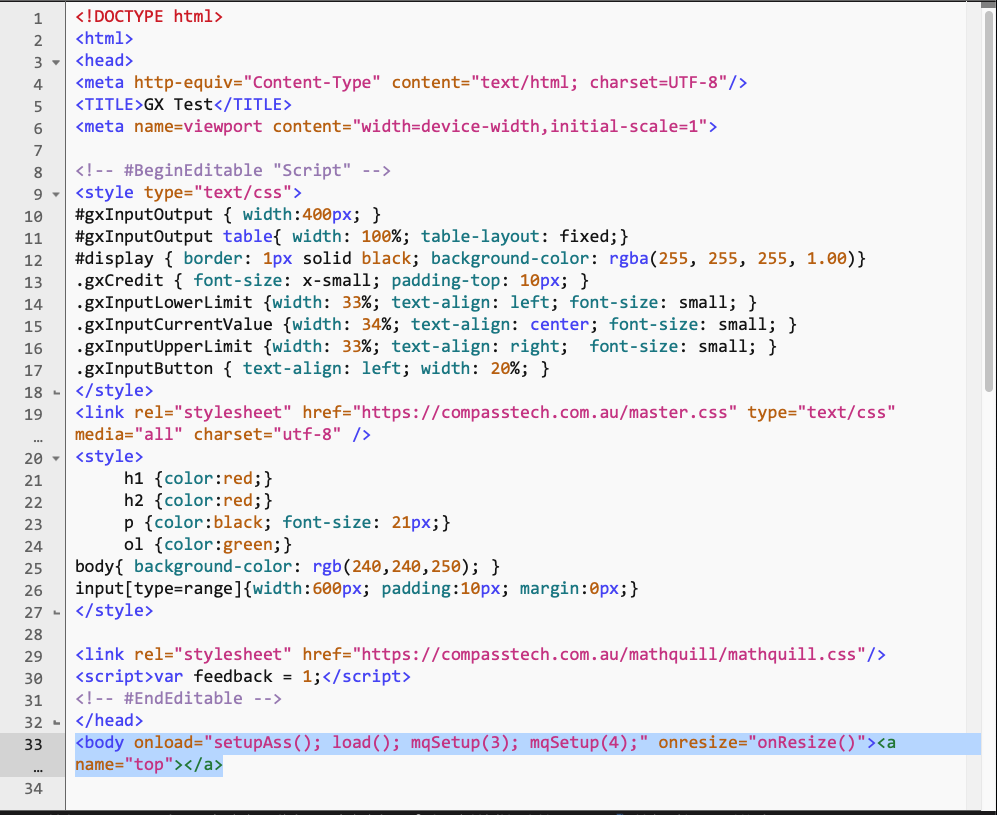
Adjust your initial <body onload... list: You will need an mqSetup for each question for which you want students to type text.
Step 4.8
Finally, adjust the names of your JavaScript source documents - and you are done!
Stage 5: Adding Some GX Pizzazz
We cannot expect to get all the wonderful features of the full Geometry Expressions software when using the free browser-based version, and I would still strongly recommend moving up to the full version for all that it offers. But there are perhaps a couple of really nice GX features that we can add to our GXWeb applet that make it even more suitable as a mathematics learning tool.
Step 5.1: Add Fill Colour
The first of these features is fill - the ability to add coloured fill to polygonal shapes constructed from line segments/intervals - GXWeb does not have the polygon construction tool of its big sibling, but segments/intervals do the job nicely, as shown in our Meeting example.
While we can draw the eye of the user to our shape by thickening and colouring the joined intervals, filling with colour is far more effective - and easily achieved! Just copy the following and paste it at the beginning of the drawShapes(TranMat, InvTranMat, wrld, ctx) function in testgx.js. (Make sure you paste it AFTER the opening brace ({)!)
submitBeginPath(ctx);
submitMoveTo(TranMat, ctx, new Point(JGOB14X, JGOB14Y));
submitLineTo(TranMat, ctx, new Point(JGOB8X, JGOB8Y));
submitLineTo(TranMat, ctx, new Point(JGOB9X, JGOB9Y));
submitLineTo(TranMat, ctx, new Point(JGOB11X, JGOB11Y));
submitLineTo(TranMat, ctx, new Point(JGOB6X, JGOB6Y));
submitLineTo(TranMat, ctx, new Point(JGOB5X, JGOB5Y));
submitLineTo(TranMat, ctx, new Point(JGOB14X, JGOB14Y));submitFill(ctx, 128, 255, 255, 0.60);
submitStroke(ctx, "#000000", 1);All that we are doing here is joining each vertex of our polygon (in the sample shown above, that is points AEHCGFA) and the code does the rest.
Step 5.2: Add Function Graphs
The second enhancement involves a few more steps, but adds a powerful mathematics teaching and learning capability to our page: the ability to graph multiple functions.
Copy and paste the following code snippets within the testgxw.js document
On about line 40 of the document, you will find the // Declaration code followed by the definitions of some current functions. Paste the following immediately after the "Declaration Code" line.
function JGOB100Y(X){return f(X);}
function JGOB101Y(X){return g(X);}
function JGOB102Y(X){return h(X);}var textUIFf;
var f=Math.sin;
var textUIFg;
var g=Math.sin;
var textUIFh;
var h=Math.sin;Around line 190, you will find function updateInputs(): after the opening brace ({) paste:
f = new Function("x","with(Math){ return "+ReplaceInfixPower(textUIFf.value)+";}");
g = new Function("x","with(Math){ return "+ReplaceInfixPower(textUIFg.value)+";}");
h = new Function("x","with(Math){ return "+ReplaceInfixPower(textUIFh.value)+";}");Next scroll down to function setMinBounds(wrld) and, after the usual opening brace ({) paste the following:
// Bounds JGOB100
addFunctionBounds(wrld, JGOB100Y, 0, 0);
// Bounds JGOB101
addFunctionBounds(wrld, JGOB101Y, 0, 0);
// Bounds JGOB102
addFunctionBounds(wrld, JGOB102Y, 0, 0);Next to function drawShapes and at the END of this function (just before function init()) paste:
// Draw JGOB100
drawFunction(wrld, TranMat, ctx, JGOB100Y, 0, 0, "#ff0000", 2)// Draw JGOB101
drawFunction(wrld, TranMat, ctx, JGOB101Y, 0, 0, "#00ff00", 2)// Draw JGOB102
drawFunction(wrld, TranMat, ctx, JGOB102Y, 0, 0, "#0000ff", 2)Almost done: paste the following at the start of the init() function:
textUIFf = document.getElementById("UIFf");
textUIFg = document.getElementById("UIFg");
textUIFh = document.getElementById("UIFh");Now to the very end of the init() function (just before computeGeometry) and paste:
textUIFf.onchange = function() {
doFullUpdate(commonGlobal.world, commonGlobal.screenBox, commonGlobal.canvas, commonGlobal.context, commonGlobal.world2Screen, commonGlobal.screen2World);
};textUIFf.onchange();
textUIFg.onchange = function() {
doFullUpdate(commonGlobal.world, commonGlobal.screenBox, commonGlobal.canvas, commonGlobal.context, commonGlobal.world2Screen, commonGlobal.screen2World);
};textUIFg.onchange();
textUIFh.onchange = function() {
doFullUpdate(commonGlobal.world, commonGlobal.screenBox, commonGlobal.canvas, commonGlobal.context, commonGlobal.world2Screen, commonGlobal.screen2World);
};textUIFh.onchange();
This completes our additions to testgxw.js. Now we need to adapt our test.js document so that the web page includes places to enter values for our three new functions.
Find var gxWebCode and scroll down towards the end of this definition until you see </table><br/>. On the following line (before the </div>) paste the following:
<P><button onclick="resetGXW();" style="font-size : 18px; width: 99%; height: 40px;">RESET</button></P>
<P><button onclick="viewTableGXW();" style="font-size : 18px; width: 99%; height: 40px;">Table of Values</button></P>
<center>
<table id="grphs">
<tr><td><button id = "fxButton" onclick="setFX();" style="color:red; font-size : 24px; width: 100%; height: 80px;">f(x)</button></td><td><center>
<div id="myVar" type="text" onchange="setFX();" style="border: 3px solid red; font-size : 24px; width: 100%; height: 80px; color:red; background:white;">x</div></center>
<span ID="myVar_latex" style="display:none;"></span>
<span ID="myVar_mtext" style="display:none;"></span>
</td></tr>
<tr>
<td width=30% style='font-family:serif; font-size:24px; color:red;'><center><i>f(x)</i></center></td>
<td width=69%> <input id="UIFf" style="font-family:serif; font-size:24px; color:red; width:90%" value="0" />
</td></tr><tr>
<td width=30% style='font-family:serif; font-size:24px; color:green;'><center><i>g(x)</i></center></td>
<td width=69%> <input id="UIFg" style="font-family:serif; font-size:24px; color:green; width:90%" value="0" /> </td>
</tr>
<tr>
<td width=30% style='font-family:serif; font-size:24px; color:blue;'><center><i>h(x)</i></center></td>
<td width=69%> <input id="UIFh" style="font-family:serif; font-size:24px; color:blue; width:90%" value="0" /> </td>
</tr>
</table>
Clearly, the new web page is a big improvement on the original version:
By the way, you may notice that the "invisible" grey background of previous versions has been replaced by a clear white background: easily accomplished by looking for this line at the start of the page code:
#display { border: 1px solid black; background-color: rgba(255, 255, 255, -56411.72)}
Now just replace the value of -56411.72 with 1.0! (This is the transparency of the page background)
Notice, too, that the plain axis lines have been updated from
// Draw JGOB23
drawInfiniteLine(wrld, TranMat, ctx, JGOB23A, JGOB23B, JGOB23C, "#404040", 1);
// Draw JGOB24
drawInfiniteLine(wrld, TranMat, ctx, JGOB24A, JGOB24B, JGOB24C, "#404040", 1);to
drawAxis(wrld, TranMat, InvTranMat, ctx, 0, 1, 0, "#000000", 1, 0, 0, 0, "#000000");
drawAxis(wrld, TranMat, InvTranMat, ctx, 1, 0, 0, "#000000", 1, 1, 0, 0, "#000000");We have upgraded the \(f(x)\) graph entry with a MathQuill MathBox. This supports correct entry of mathematical notation, with students receiving immediate feedback as terms are entered. Look for script links that support this powerful tool: a style link in the HEAD and the three script src links at the end of the BODY:
<script src="https://ajax.googleapis.com/ajax/libs/jquery/1.11.0/jquery.min.js"></script>
<script src="https://compasstech.com.au/mathquill/mathquill.js"></script>
<script src="https://compasstech.com.au/gx/latex2math.js"></script>
Home ← Live Mathematics and STEM on the Web ← My First Web Page: Creating Beautiful Mathematics ← Geometry Expressions Showcase: Learn How
