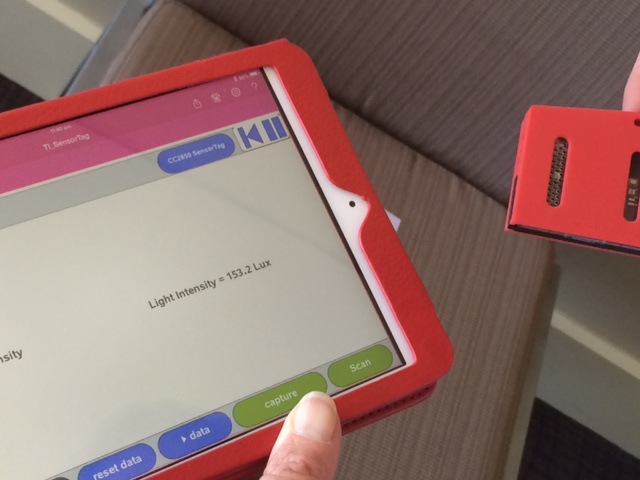
TI SensorTag: Real world data in the palm of your hand
Texas Instruments TI-Nspire Scripting Support Page
Download the SensorTag TI-Nspire document
GeoGebra and the TI SensorTag (free)
- Introducing the SensorTag
- Putting the SensorTag to Work
- Sharing Data - the Easy Way
- Some Classroom Applications to Get Started
- Where is the Best Place to Sit in our Classroom?
- Build your own weather station
- Build your own Remotely Monitored Greenhouse
- Explore the Mathematics of Movement (and exercise and dance?)
- Which is the best cup shape for my cup of tea or coffee?
- Could I use barometric pressure to measure altitude?
- Could I use light intensity to measure distance from the light source?
- Could I use the magnetometer as a compass?
- Could I use the accelerometer to measure distance and velocity of a moving object?
- Could I use the accelerometer to control a screen object?
- Try For Yourself!
- Conclusion
Some Classroom Applications to Get Started
- System ID
- Model Number
- Firmware Revision
- Hardware Revision
- Software Revision
- Manufacturer Name
- Battery Level
- %
|
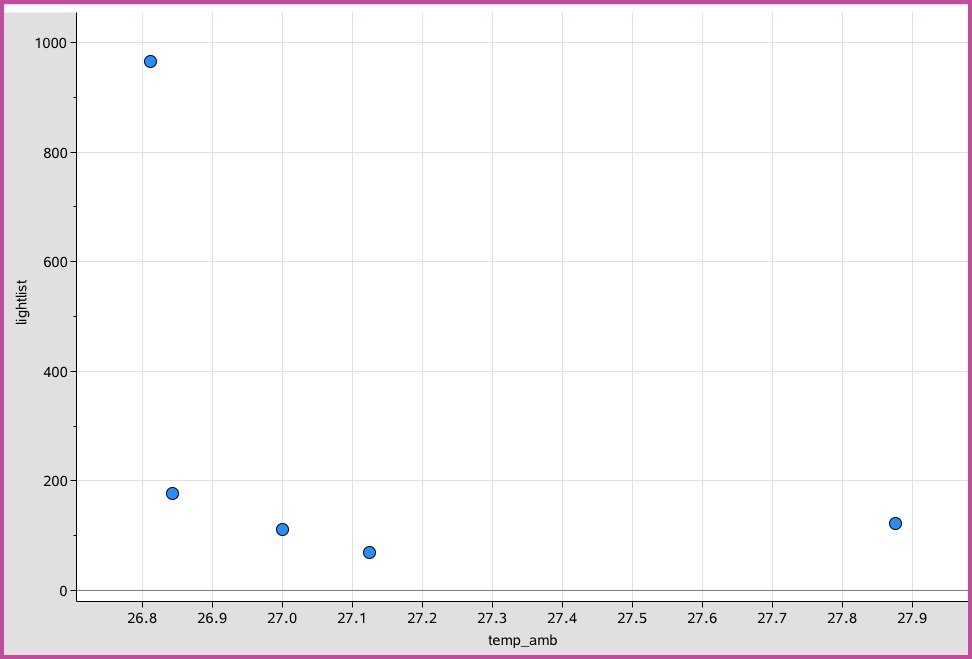
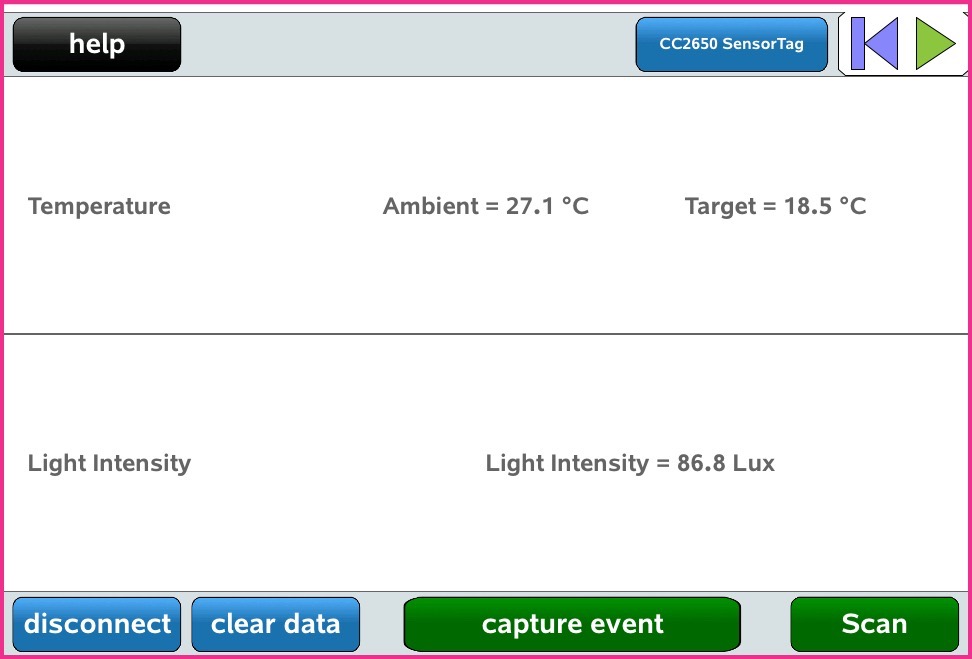
Where is the Best Place to Sit in our Classroom? Like most of the best STEM-active questions, the answer is ... It depends! Some people feel the cold more than others, and like to sit near a heater. For others, they want to be as far away from the heat source as possible. Some like to sit where the light is bright. There are numerous factors that determine our preferences, and these can be easily explored using the TI-SensorTag. Just select the Temperature and Light Intensity sensors on start-up, and use the Capture Event button to grab the readings at different points around the room. This can even be set as a game challenge. In the past, I would go into the room before the students and collect temperature and light data from several points, then display the graph to the students and ask them to decide where these spots are located! It offers a fun and worthwhile challenge. |
  |
|
Build your own weather station Students might record temperature, humidity and barometric pressure for a week and compare that with the published data. Or have them record the changes in temperature, humidity, light intensity and barometric pressure throughout the day. Account for observed differences? How accurate is the data they collect? How might they validate this? How might the barometer be used to predict the weather over the coming days? Note: MyWeatherCenter is an iPhone/iPad app that links with the SensorTag to provide readings for local temperature, humidity and barometric pressure - which can be compared to the current readings for your location from the web! Not free but well worth a look! |
 |
|
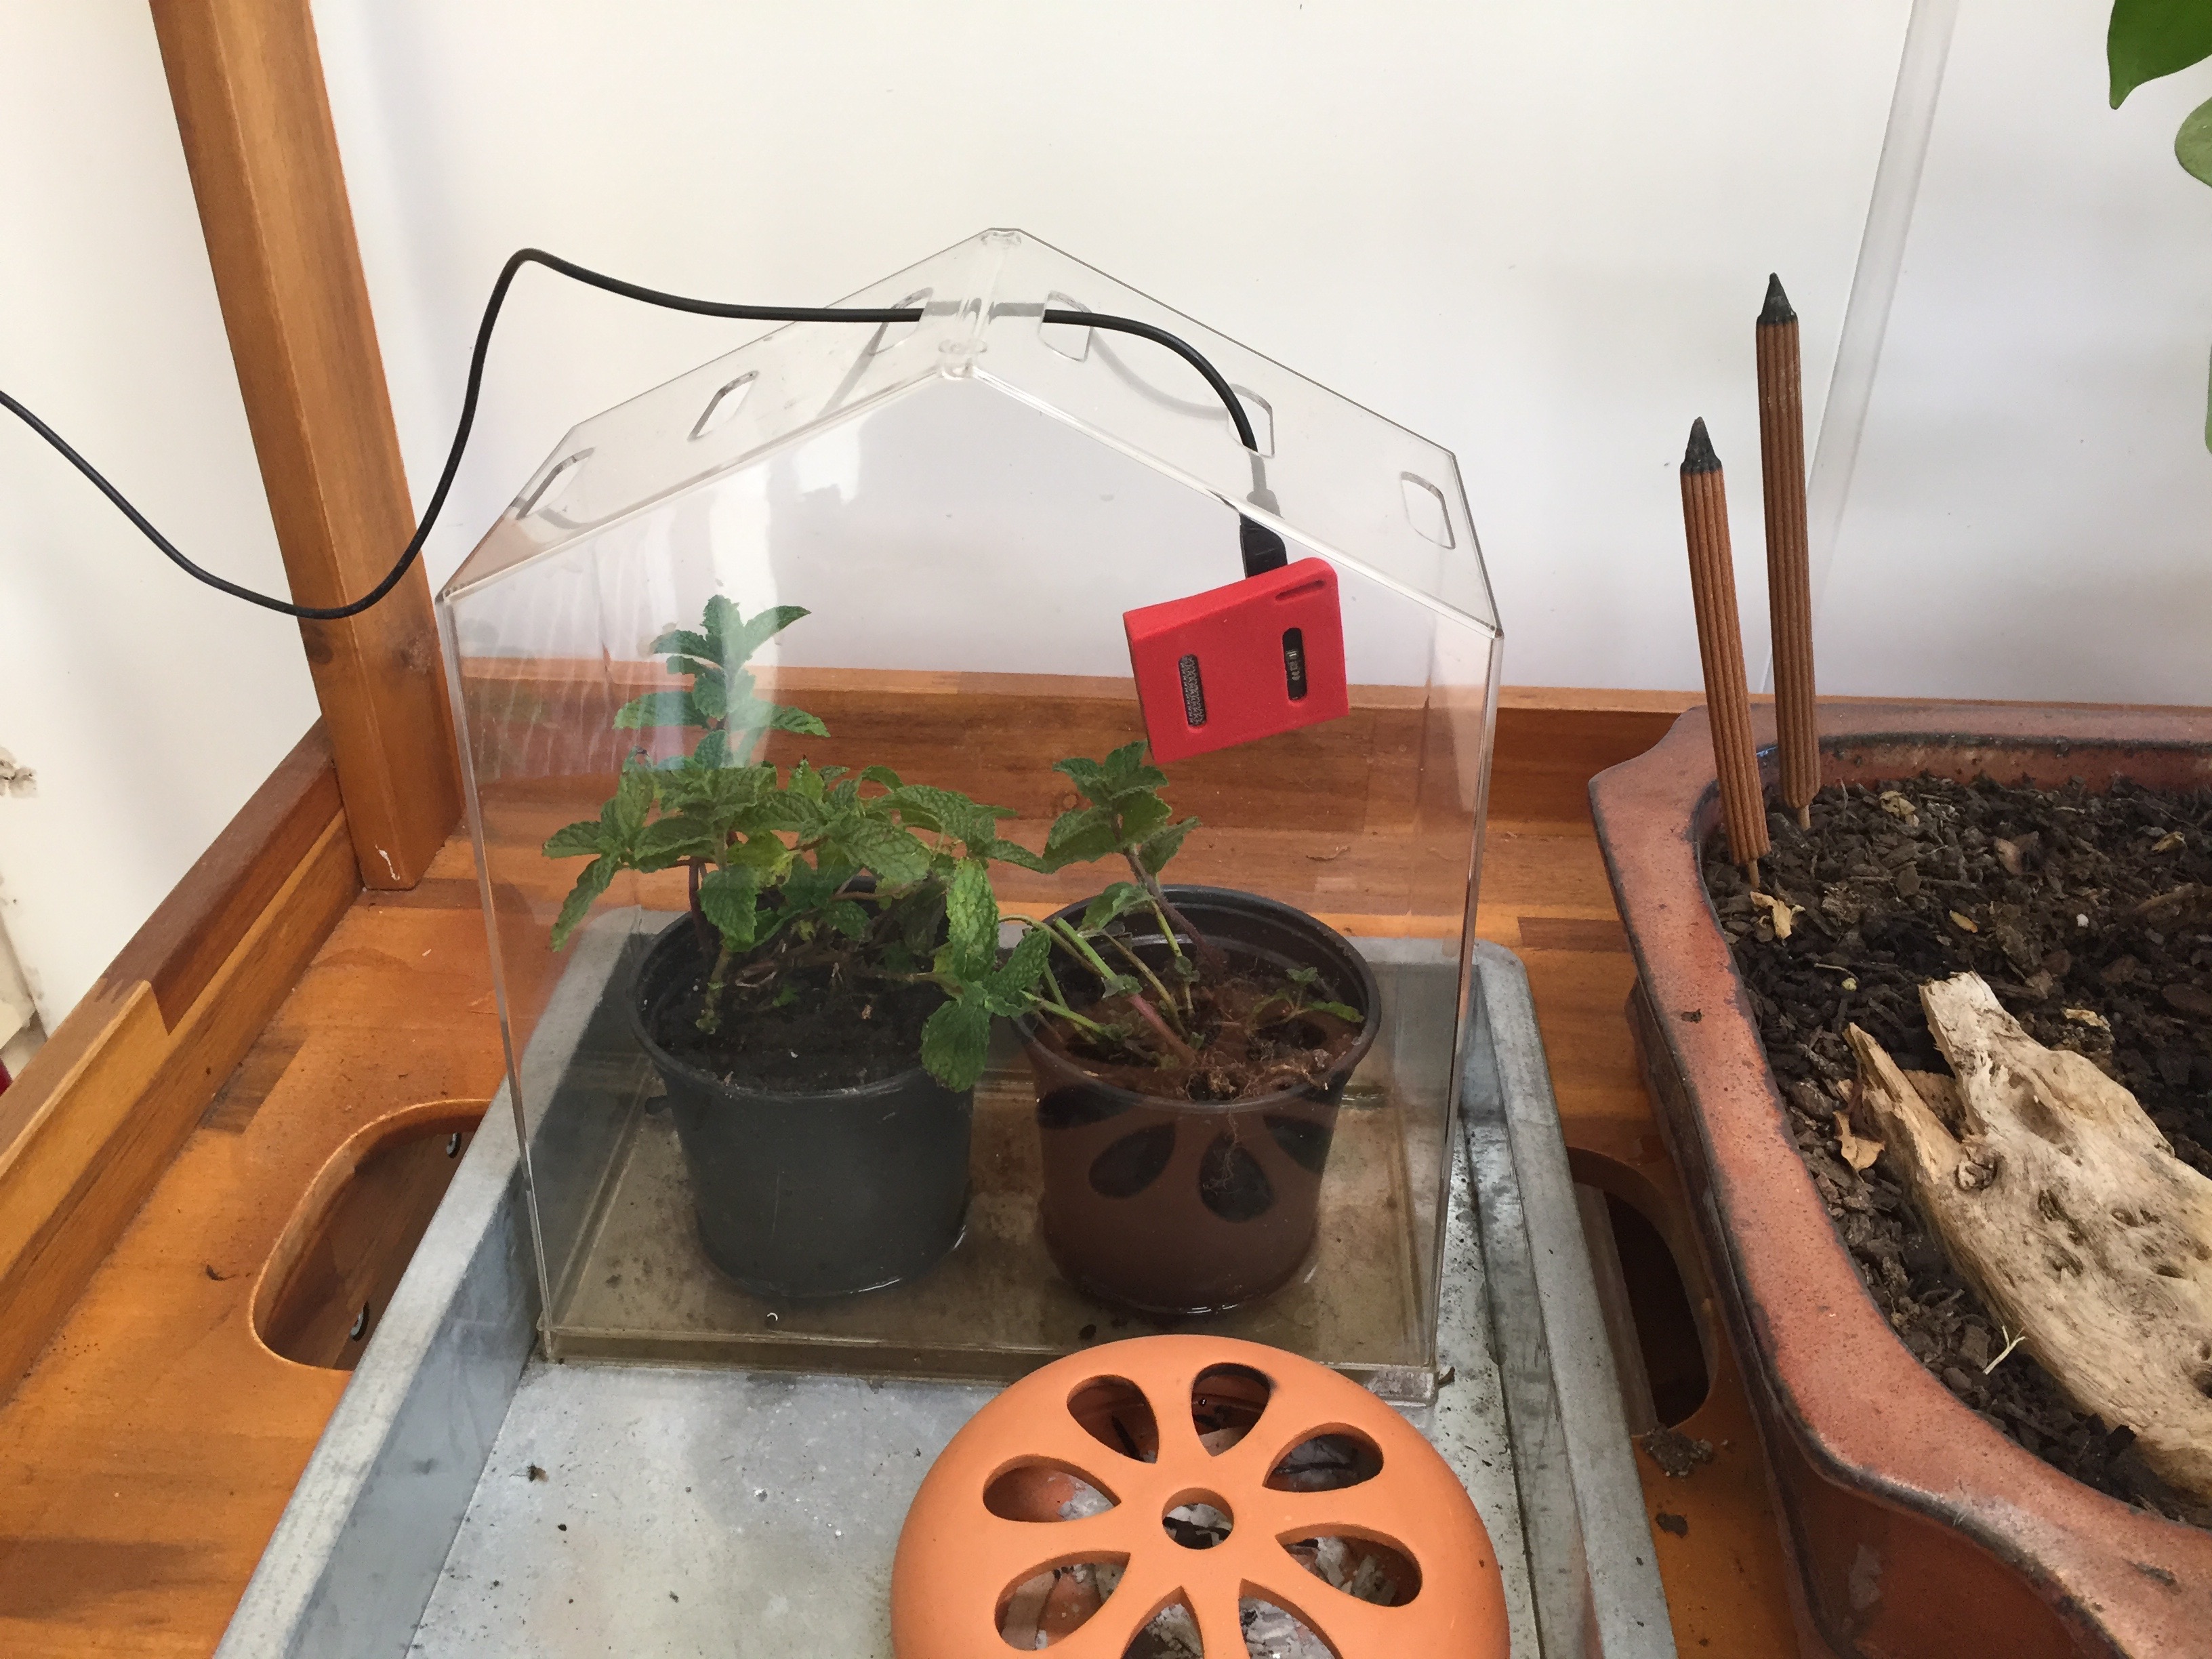
Build your own Remotely Monitored Greenhouse Why not use the SensorTag to monitor conditions in their own model greenhouse AND to raise alerts when things might get challenging for their plants? The SensorTag includes red and green LED lights and a small buzzer - these may be programmed easily to raise a warning when temperatures get too high or too low, when humidity becomes oppressive - or even when it gets dark! What factors are most likely to impact the optimal growth of greenhouse plants? How might these be monitored? How accurate is the data they collect? How might they validate this? |
 |
|
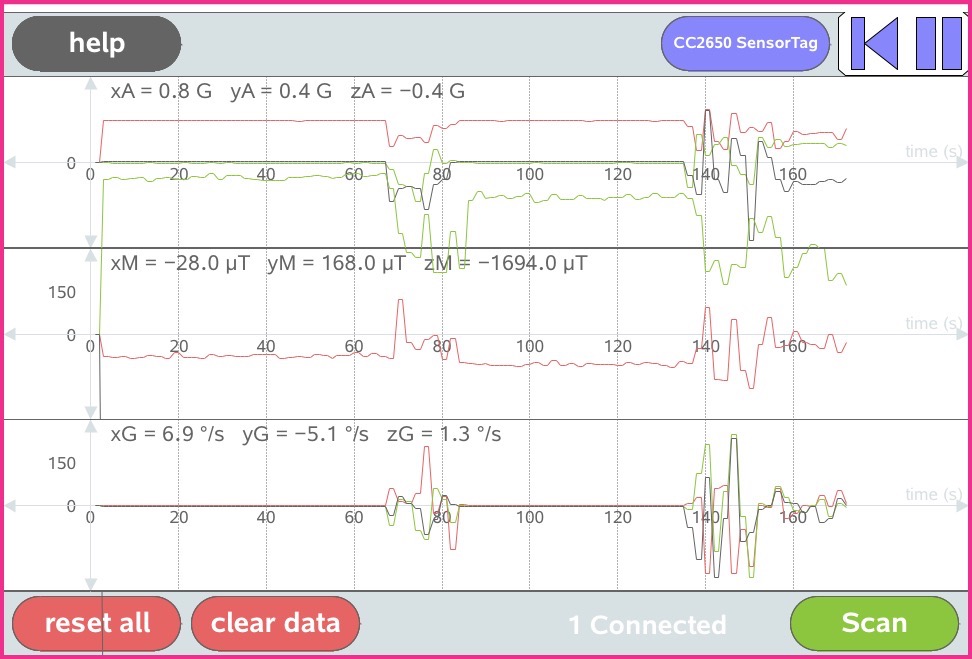
Explore the Mathematics of Movement (and exercise and dance?) Invite students to investigate accelerometer data as they move around - can they identify x, y and z axes? Could they use the accelerometer to count the number of steps they take when walking? How does this correspond to the other movement sensors? How might they design experiments that will reveal the meaning of what they see? Perhaps link these sensors to a heart rate monitor and study the effects when exercising, or dancing? |
 |
|
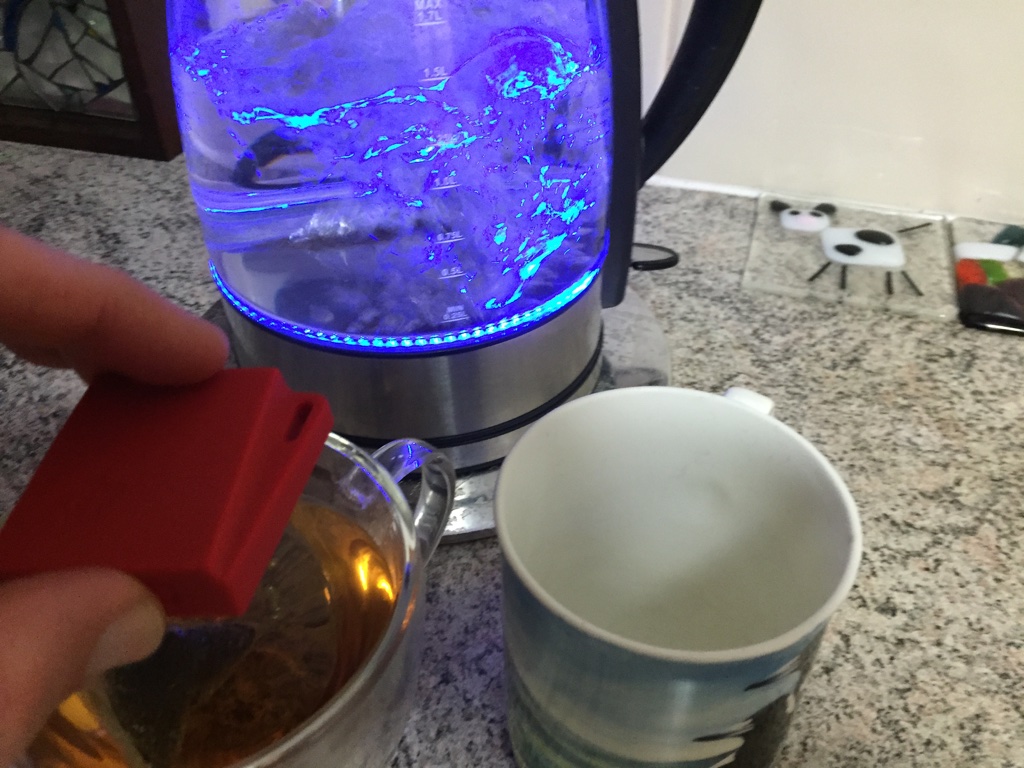
Which is the best cup shape for my cup of tea or coffee? Which cup will keep my drink hot (or cold) longer? Record the cooling over time using the InfraRed Temperature sensor. Use the Calibrate feature to capture events at regular intervals for, say 30 minutes. Explore the shape of the curve which results. Is it what was expected? (Data and statistics) What function would best model this? (mathematics) What have they learned about cooling? Can this be generalised? (science) Can you account for observed differences? How might the most effective exploration be designed? How accurate is the data they collect? How might they validate this? |
 |
|
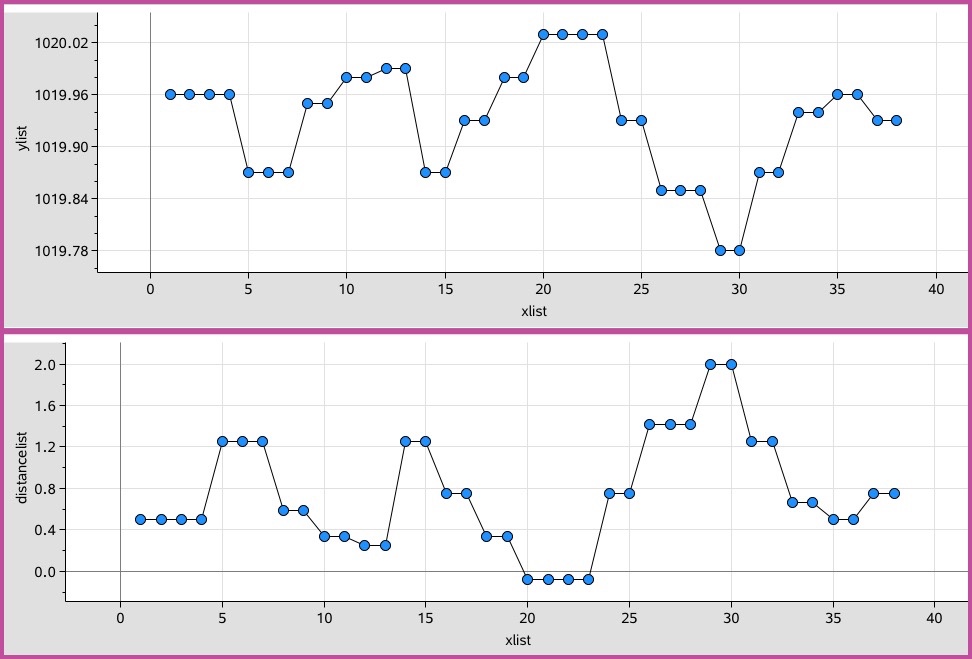
Could I use barometric pressure to measure altitude? What do students know about air pressure? What is being measured by the barometer, and how might this be related to altitude (science) How might students convert their barometric pressure readings to measure height above a given point? (mathematics and science) Can you account for observed differences? How might the most effective exploration be designed? How accurate is the data they collect? How might they validate this? |
 |
|
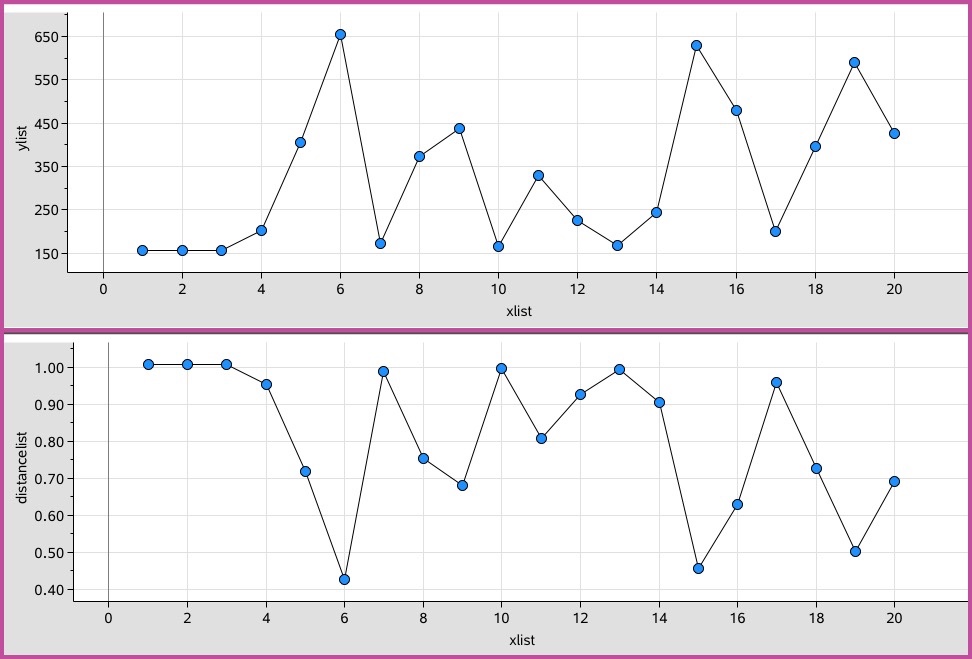
Could I use light intensity to measure distance from the light source? What do students know about light intensity and its relationship to distance from the source? (science) How might their readings be calibrated and converted: changing light intensity to metres? Can you account for observed differences? How might the most effective exploration be designed? How accurate is the data they collect? How might they validate this? |
 |
|
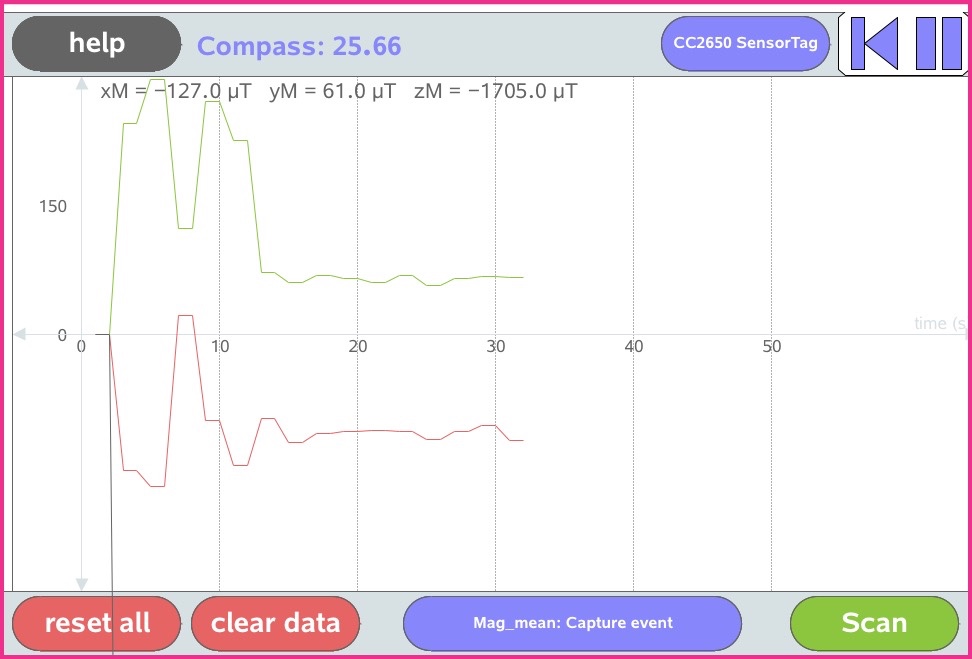
Could I use the magnetometer as a compass? If the magnetometer measures magnetic field strength in three dimensions, then it should be measuring the earth's magnetic field, as well as local magnetic sources (and what are these, by the way? Which common things in the home and classroom generate magnetic fields of varying strength?) How might magnetometer data be converted to give compass headings? Can you account for observed differences? How might the most effective exploration be designed? How accurate is the data they collect? How might they validate this? |
 |
|
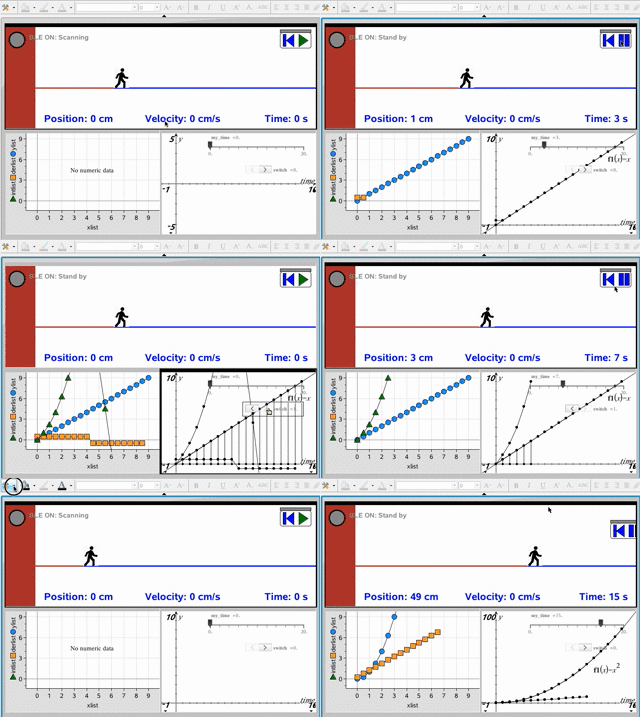
Could I use the accelerometer to measure distance and velocity of a moving object? This one could be challenge, but may not necessarily be just for the senior calculus students. Simple understanding of gradient and area under curves may be sufficient for a deep and worthwhile exploration. Initially, students might explore, for example, how constant acceleration reveals information about the speed and displacement of the moving object. Extend that to other functions - linear, quadratic... Under controlled conditions, acceleration data may indeed reveal more than we might expect, but what are the limitations? Can you account for observed differences? How might the most effective exploration be designed? How accurate is the data they collect? How might they validate this? |
 |
|
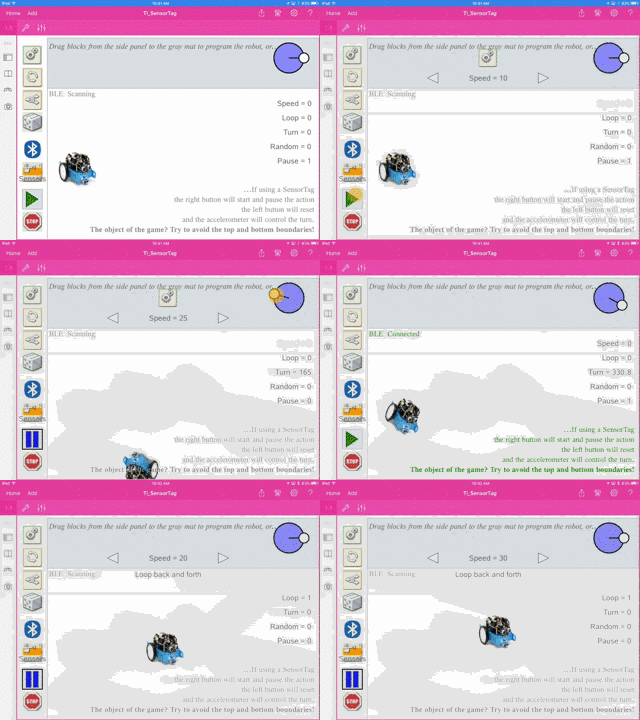
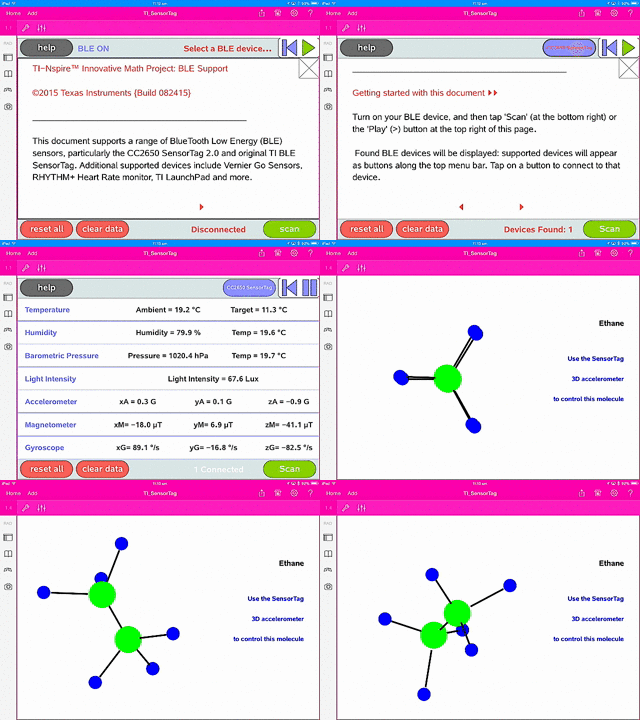
Could I use the accelerometer to control a screen object? Another challenge, but with considerable rewards for students who are interested in such things as 3D graphics and gaming. A fun introduction to the movement sensors - control a virtual robot! The SensorTag buttons will start and pause, the accelerometer (or other selected sensor) will steer. The challenge here is to try to "stay between the lines"! The 3D accelerometer data is readily accessible from the SensorTag, so students may access it using TI-Nspire native tools, and performs calculations and conversions in the more familar environment without needing to know Lua scripting. From here, further challenges, such as using the SensorTag to control a screen mouse... |
  |
If you have a SensorTag and happen to be using the Chrome browser on a recent (mid-2012+) Mac, Android (M) or ChromeBook, then try it out right now! Just click the Connect button at the top of the page and see the TI SensorTag in action!
Input:
IO Service / Simple Keys Service
Pressing the buttons below, you can turn on/off the LEDs and the buzzer.
When you press the buttons on the side of the CC2650, the indicators on either side of the picture will be highlighted. |
Device Information |
Home ← STEM HQ ← TI-Nspire Scripting HQ ← TI SensorTag: Real world data in the palm of your hand← TI SensorTag: Some Classroom Applications to Get Started
Copyright © 2016, Futomi Hatano, All rights reserved. Code licensed MIT
