©2019 Compass Learning TechnologiesLive Mathematics on the Web GeoGebra Assessment Showcase ← View My Data

View My Data

Learn How: Create Your Own Live GeoGebra Web Pages

OzDASL: Australian Data and Story Library

iNZight Lite: Data and Statistics for Everone

TI SensorTag: Real World Data in the Palm of your Hand


Quickly and easily view your datasets using this simple GeoGebra utility...

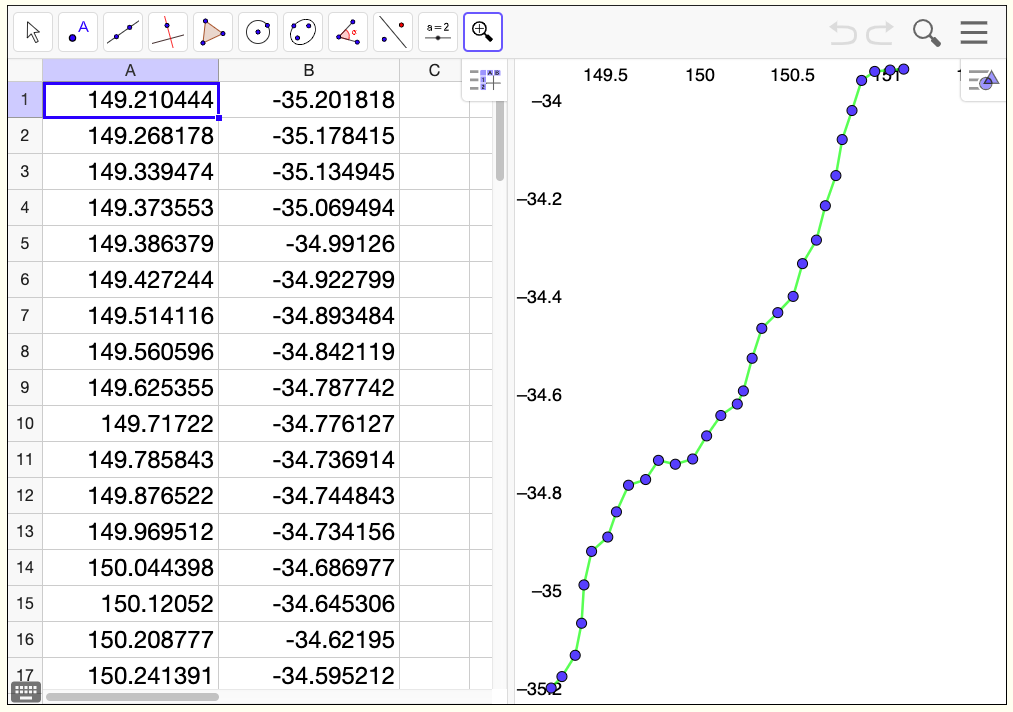
Tap the image to see how to use the web tools on this page... ⇓

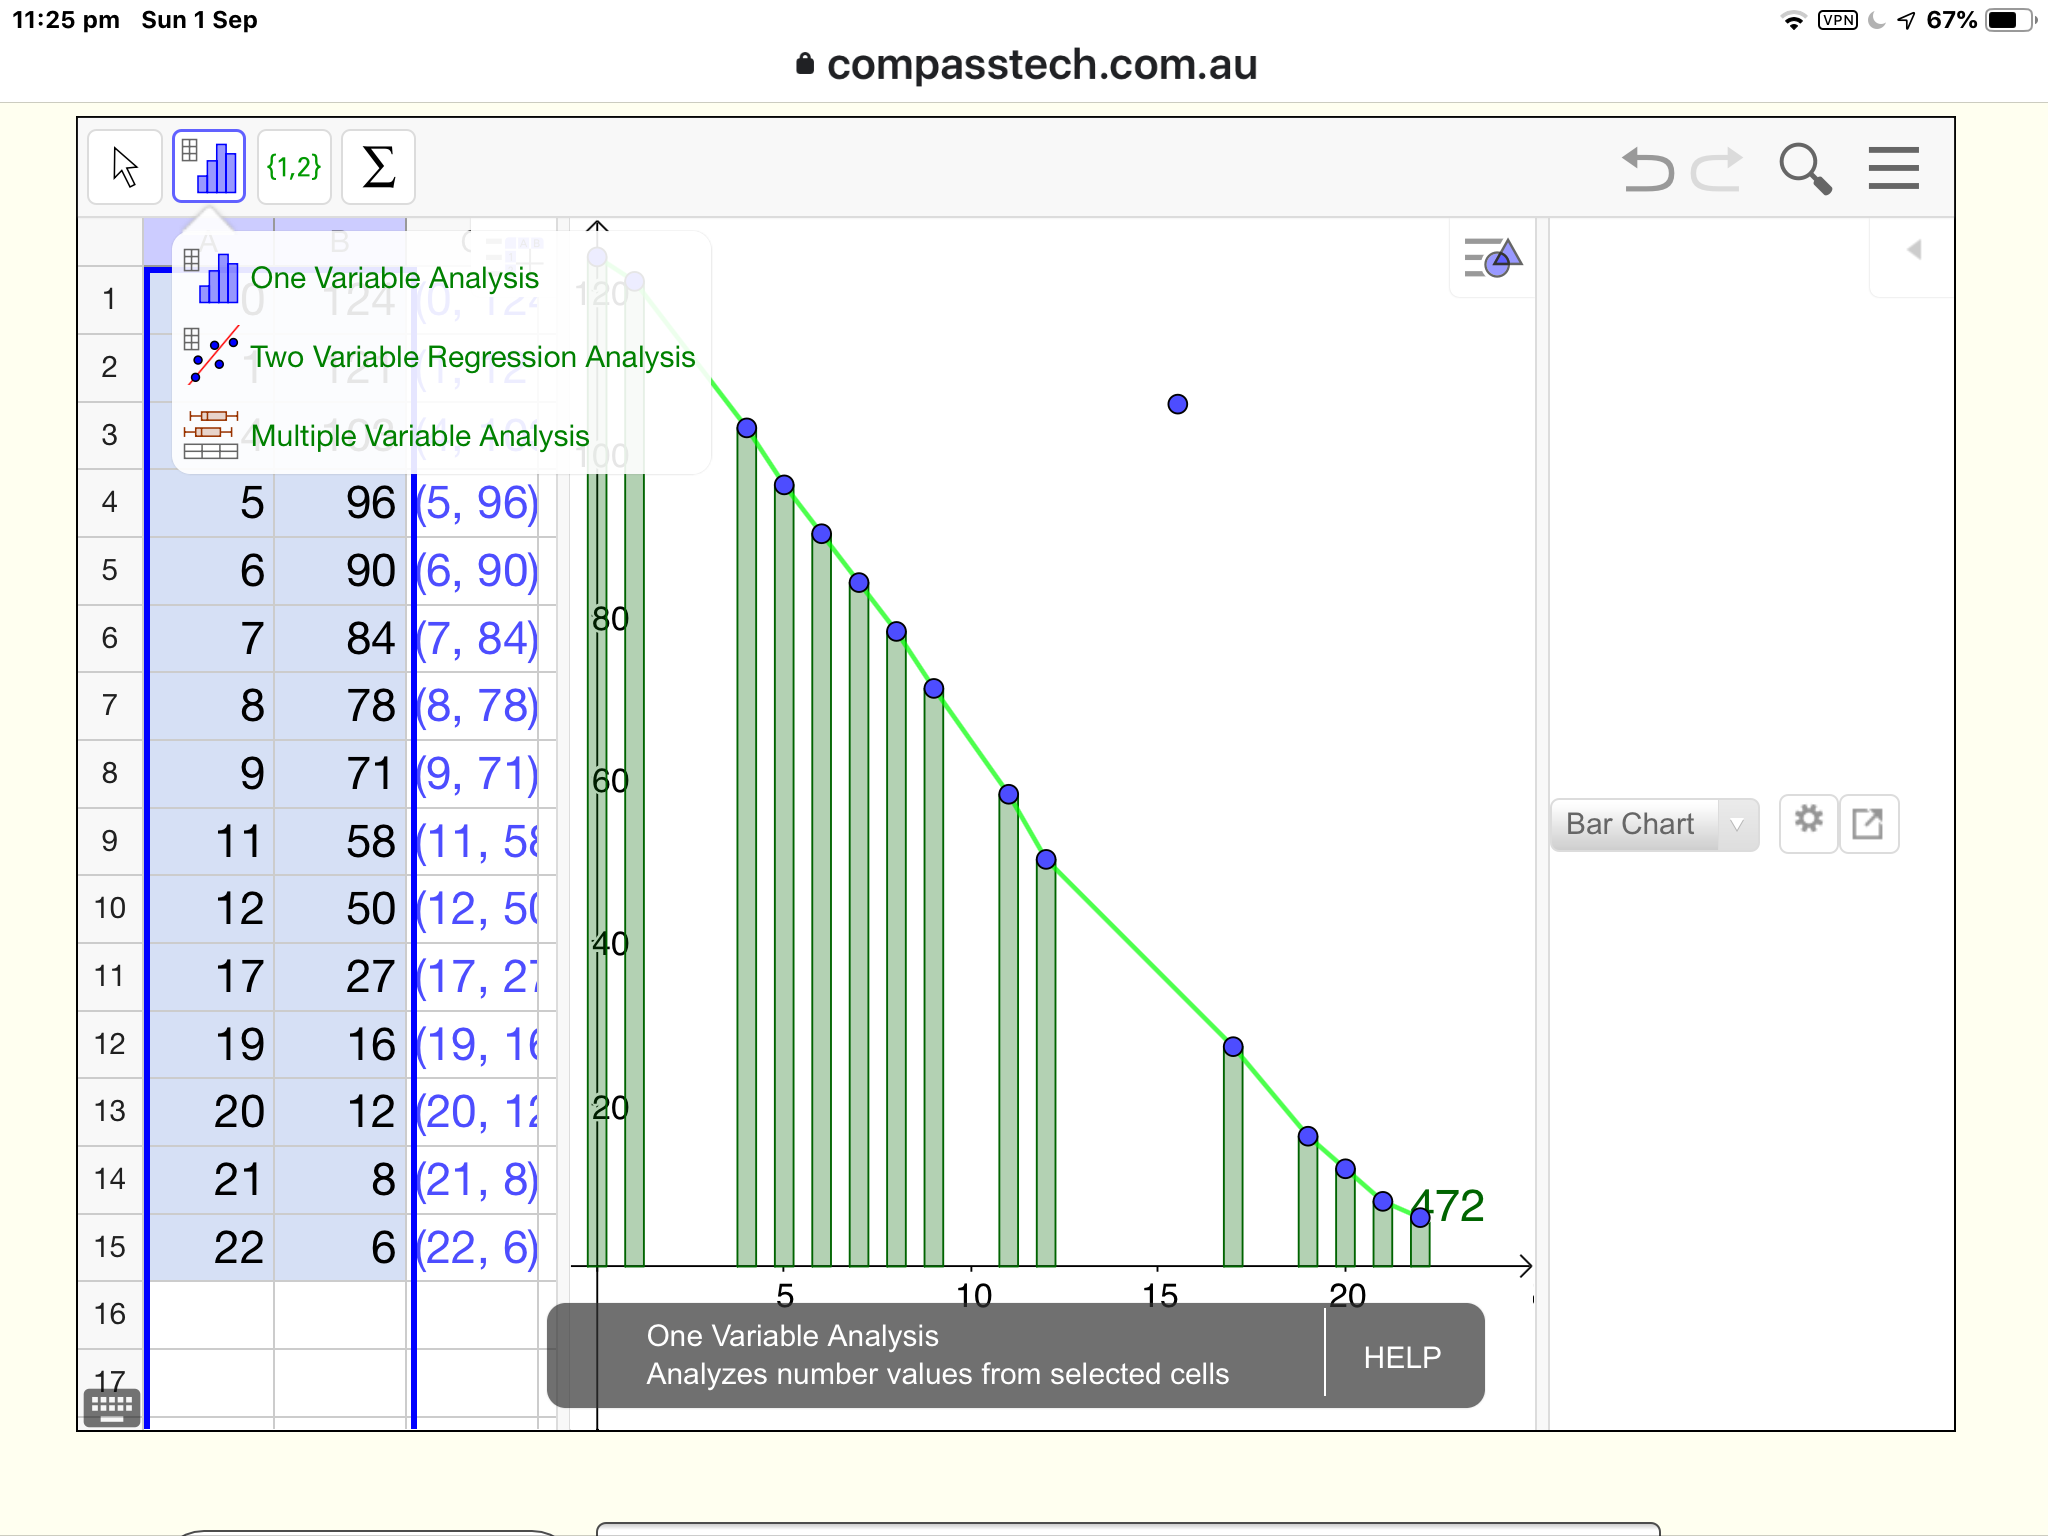
Tap the image to see how to use the GeoGebra Data Analysis tools ⇓


Enter one or two data sets into the fields below, and then select one of the Chart My Data buttons.

For individual (univariate) data sets (DataSet1 and/or DataSet2), each value will be numbered sequentially.

For paired (bivariate) data sets, DataSet1 becomes the horizontal (independent) value set and DataSet2 the vertical (dependent) set.

Note: To access GeoGebra's in-built Data Analysis tools, select list data from the spreadsheet (simplest way is to drag across the column headers to select those columns), and then select the Analysis menu as shown - it is the first of the three spreadsheet menus.

Explore the three menus available, and the various options available within these. They offer a couple of more options for you to view and analyse your data sets.

Back to Top


Back to Top


Back to Top


Back to Top


Sample 1: Bar of soap

Do you use up the same amount of the soap in the shower each morning, or does it depend on the size of the bar of soap?

This data was collected by Rex Boggs in Rockhampton, Queensland.

"I had a hypothesis that the daily weight of my bar of soap in my shower wasn't a linear function, the reason being that the tiny little bar of soap at the end of its life seemed to hang around for just about ever. I wanted to throw it out, but I felt I shouldn't do so until it became unusable. And that seemed to take weeks."

Day = {0,1,4,5,6,7,8,9,11,12,17,19,20,21,22}

Weight = {124,121,103,96,90,84,78,71,58,50,27,16,12,8,6}

Back to Top


Sample 2: Kiama Blowhole: Time Between Eruptions

My family lived for many years in the beautiful seaside town of Kiama, on the South Coast of New South Wales. One of the best known features of the town is the Kiama Blowhole, which blows regularly - or at least, semi-regularly.

This data set shows the time (in seconds) between eruptions over an extended period.

Study the data using different representations. Any predictions you could make?

Eruptions = {83,51,87,60,28,95,8,27,15,
10,18,16,29,54,91,8,17,55,10,35,
47,77,36,17,21,36,18,40,10,7,34,
27,28,56,8,25,68,146,89,18,
73,69,9,37,10,82,29,8,60,61,61,18,
169,25,8,26,11,83,11,42,17,14,9,12}

Source: OzDASL

Back to Top


Sample 3: Road Trip Sensor Data

TI SensorTag data: Canberra to Sydney

(June 18 2016: 9:17am - 11:57 am - Collected using DataWorks app and iPhone 6)

Data points were collected at approximately 1 minute intervals from 9:20 am (outside Canberra) until just before midday (Sydney).


Back to Top


Back to Top


Interested to go Further?

This page is presented as a quick and easy browser-based option for simple data sets. For some real data display and analysis, you should explore iNZight lite and its desktop-based big brother, iNZight.

These are powerful but easy to use tools for exploring and understanding data of all types.

Back to Top


Home Live Mathematics and STEM on the Web GeoGebra Assessment Showcase ← View My Data