Home ← TI-Nspire Authoring ← TI-Nspire Scripting HQ ← Scripting Tutorial - Lesson 8
Scripting Tutorial - Lesson 8: Quick Start: Working with Graphics
Download supporting files for this tutorial
Download this page in PDF format
Texas Instruments TI-Nspire Scripting Support Page
Like Lua's image manipulation commands, the graphics commands are simple and intuitive. Begin by noting that the maximum screen resolution available to Lua programs within TI-Nspire is 318 by 212 pixels. Each of the graphics commands must be called within a graphics context. In other words, within the now-familiar function on.paint(gc) each graphics command must be preceded by gc:. You can use a graphics command within a user-defined function by setting gc as an argument, but this function must be called within the on.paint(gc) function.
Lesson 8.1: Graphics Commands: Reference
The basic graphics commands are as follows (remember Lua is case sensitive!):
drawLine(xstart, ystart, xend, yend) - draws a line between the given coordinates.
drawRect(x, y, xwidth, yheight) - draws a rectangle at (x, y) with length and height as given. fillRect(x, y, xwidth, yheight) - fills a rectangle at (x, y) with the last defined color. drawPolyLine({x1, y1, x2, y2,..,xn, yn, x1, y1}) - draws a polygon linking the ordered pairs. Note: to close the polygon it must end where it began. The figure is NOT automatically closed, which explains why it is not called "drawPolygon". fillPolygon({x1, y1, x2, y2,..,xn, yn, x1, y1}) - fills a polygon defined by the coordinate points. It must be closed. drawArc(x, y, width, height, start angle, turn angle) - draws an arc at (x, y) with width and height as given and closing the desired angle. A circle will be defined from 0 to 360. fillArc(x, y, width, height, start angle, turn angle) - fills the defined arc or circle. drawString("string", x, y [, Position]) - draws a string at the given coordinates. Position is the string's anchor point: it can be "bottom", "middle" or "top". getStringWidth(string) - returns the string width. getStringHeight(string) - returns the string height. Other useful graphics commands include:
isColorDisplay() returns 1 if color (CX), 0 if not.
setAlpha(integer) - where the argument is an integer between 0 and 255, sets the transparency. setColorRGB(red, green, blue) RGB values are integers between 0 and 255. setFont(font, type, size) - font: ("sanserif", "serif",..), type: ("b", "r", "i", "bi") for bold, regular, italic and bold italic. Size is an integer value. setPen(size, style): size ("thin", "medium", "thick"), style ("smooth", "dotted", "dashed").
Lesson 8.2: Putting it to Use
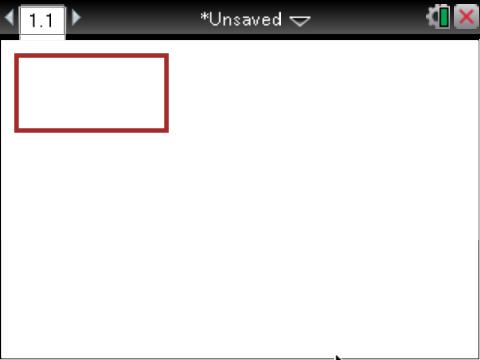
We will begin with something simple: a box. This box is to be 100 pixels by 50 pixels, and is situated at the coordinate point (10, 10), in the top left corner of the window.
function drawBox(x, y, length, height, gc)
gc:drawRect(x, y, length, height)end
function
on.paint(gc)gc:setColorRGB(165,42,42)
gc:setPen("medium", "smooth")
drawBox(10, 10, 100, 50, gc)
end
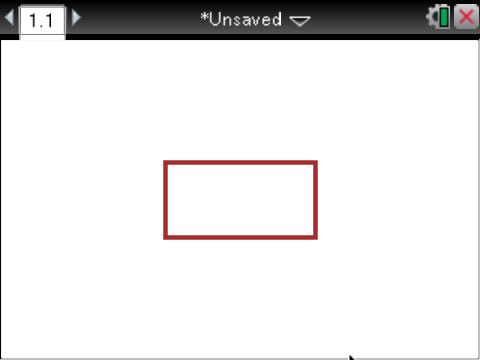
We could have simply put the gc:drawRect command in the on.paint function, but this way we are able to customize our box more easily. Why don't we place the box in the center of the window? As we have done previously, define window height and width as variables for convenience, and then use these with our box formula. We can also control the dimensions of our box: suppose we wish to make it one quarter the height of the window, and twice as long as it is high? Check the adjustments for the box to align in the center.
local screen = platform.window
function on.paint(
gc)w = screen:width()local
local
h = screen:height()gc:setColorRGB(
165,42,42)gc:setPen("medium", "smooth")
drawBox(w/2 - h/4, 3*h/8, h/2, h/4, gc)
end
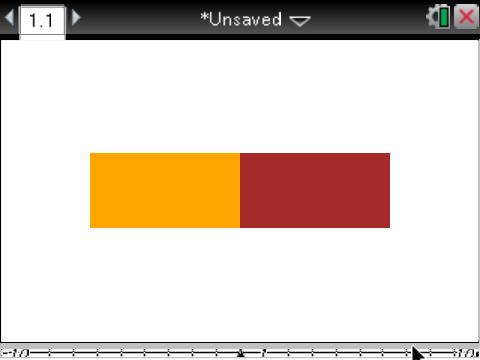
Now let's put two boxes of the same dimensions alongside each other, on either side of the center of the window. And make them different colors. And color them in! - for this last, just change the drawRect command in our box function to fillRect.
local screen = platform.window
function on.paint(gc)
w = screen:width()local
local
h = screen:height()gc:setColorRGB(
165,42,42)gc:setPen("medium", "smooth")
drawBox(w/2, 3*h/8, h/2, h/4, gc)
gc:setColorRGB(255,165,0)
drawBox(w/2 - h/2, 3*h/8, h/2, h/4, gc)
end
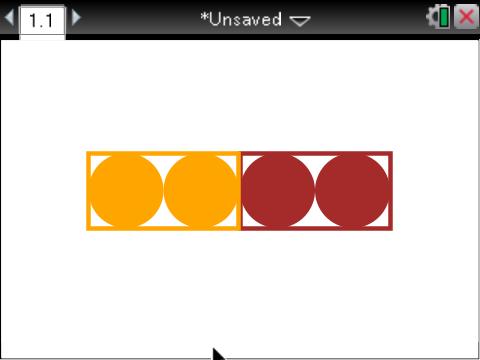
Finally, why not fill these boxes with circles? Change the box function back from fillRect to drawRect to better see our circles.
local screen = platform.window
function
on.paint(gc)screen:width()local w =
local h =
screen:height()gc:setColorRGB(165,42,42)
gc:setPen("medium", "smooth")
drawBox(w/2, 3*h/8, h/2, h/4, gc)
gc:fillArc(w/2, 3*h/8 , h/4, h/4, 0, 360) gc:fillArc(w/2 + h/4, 3*h/8 , h/4, h/4, 0, 360) gc:setColorRGB(255,165,0)drawBox(w/2 - h/2, 3*h/8, h/2, h/4, gc)
gc:fillArc(w/2 - h/4, 3*h/8 , h/4, h/4, 0, 360) gc:fillArc(w/2 - h/2, 3*h/8 , h/4, h/4, 0, 360)end
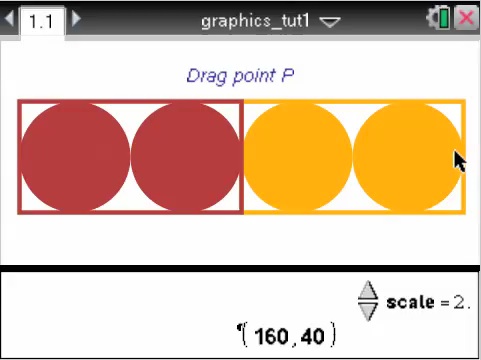
Challenge: As we did in previous tutorials, try now to link the position of the boxes to a variable linked point in a graph window, so that dragging the point around the graph window drags the boxes around the Lua window. You may also like to insert a scale variable and use it to control the dimensions of our model. Check the Lua script in the downloads folder for this lesson to see one approach to these problems.
In lesson 9 and lesson 10 you will put all that we have learned together to create dynamic models.
Home ← TI-Nspire Authoring ← TI-Nspire Scripting HQ ← Scripting Tutorial - Lesson 8