Home ← TI-Nspire Authoring ← TI-Nspire Scripting HQ ← Scripting Tutorial - Lesson 9
Scripting Tutorial - Lesson 9: Graphical Shape Numbers
Download supporting files for this tutorial
Download this page in PDF format
Texas Instruments TI-Nspire Scripting Support Page
It is time to try and put together everything that we have learned so far. In this lesson and lesson 10 we will use Lua's graphic commands along with many of the enhancements we have learned to create documents that are both useful, clear and easy to use. We will begin with the graphical display of shape numbers - square, rectangular and triangular numbers.
Take a moment to watch the accompanying movie and then have a play with this document using the Player to get a feel for the possibilities and for some of the design choices that have been made. For example, while it is great to use arrow keys and enter, escape and even tab keys to make control by both computer and handheld easy, if we want our documents to be usable with the Player then it is worth leaving in the sliders.
In the example shown, pressing up and down arrows controls the value of n, increasing and decreasing the number being studied. Left and right arrows show the three options - square, rectangular and triangular numbers. Pressing enter shows different views - the shape created using circles, with a border, and using squares. finally, pressing the tab key steps through the building up of that pattern, making it easy to see the relationships involved - square numbers are the sums of odd numbers, rectangular numbers the sum of even numbers, and because every rectangle is double the corresponding triangle, the triangular numbers are built by adding the counting numbers. Pressing escape takes you back through this progression.
We will begin by using drawLine to create a square grid corresponding to the current value of n. But first, some practical considerations - plan your design and layout! We would like our grid to lie centered on the page. We know how to do that. But we would also like it if the size of our grid remained within the visible page, with a bit of white space around it. So we could divide the width and height of the page up by the value of n (and a bit more for white space). Will also need a slider for n (and more sliders to follow!). So set up a split page with a Geometry window and slider on one side and our script window for the main window.
Look closely at the code here. We define a function (drawArray) that takes as its arguments the current value of n, the x and y coordinates of the starting position, and the length and width of each cell.
You will see that the drawLine function takes four arguments: the x and y coordinates of start and end points. We will use one variable (m) to define the horizontal lines and the other (k) for the vertical lines. Again, study the code provided to see one way in which to achieve what we desire.
Once the function is defined, we need to paint the screen to actually see it. here we choose to define the required variables within the on.paint function. Hence we define the window width and height, recall the current value of n and use it to calculate the x and y coordinates for the starting point, and the width and length of the cells. For the latter values, we divide the window dimensions by the value of n (and a little more), then take the lowest integer value. This will ensure that our model always remains within the screen dimensions. Finally, we set the color and the pen values and call our function, drawArray.
This produces a dynamic square grid, as required, controlled by the current value of a variable n within TI-Nspire.

local screen = platform.window
function
drawArray(number, x, y, length, height, gc)for k = 0, number do
for m = 0, number do
gc:drawLine(
x,
y + height * m,
x + length * number,
y + height * m)
gc:drawLine(
x + length * k,
y,
x + length * k,
y + height * number)
end
end
end
function on.paint(gc)
w = screen:width()
h = screen:height()
num = var.recall("n") or 1
xval = math.floor(w/(num+4))
yval = math.floor(h/(num+4))
x = w/2 - num * xval / 2
y = h/2 - num * yval / 2
gc:setPen("thin", "smooth")
gc:setColorRGB(165,42,42)
drawArray(num, x, y, xval, yval, gc)
end


So we have a square grid - we would like to have two variations on this theme: a rectangular grid (with one side one longer than the other) and a triangular grid. We will control these with a slider variable we will call type.
First, the rectangular numbers: essentially the same script as for the square numbers, but with one variable one more than the other.
Recall the value of variable type at the start of our drawArray function, then use it as the basis of a test: if type == 1 then (the square routine) elseif type == 2 then (rectangles) else (triangles) end.

The triangle follows - the main variation from the two previous forms is that, instead of the second variable running from 0 or 1, it begins at the current value for k, thus indenting each line to form the triangle. In order to close the figure, it was necessary to add an additional line at top and another at the right side - hence the four lines in this script where the others had only two.
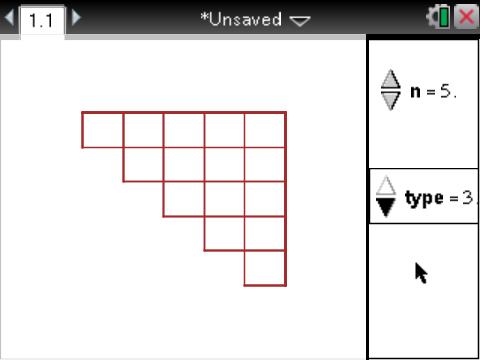
Add the line which defines the variable types from type and the first condition (if types == 1 then) at the start of the function definition, and this script will deliver the three shapes drawn using a grid.
In the final tutorial in this series this script is further enhanced using circles to dynamically build each of the patterns, and our usual arrow key controls will be added.
function drawArray(number, x, y, length, height, gc)
types=(var.recall("type") or 1)
if types == 1 then
... (as above)
elseif types == 2 then
for k = 0, number + 1 do
for m = 0, number do
gc:drawLine(
x,
y + height * m,
x + length * (number + 1),
y + height * m)
gc:drawLine(
x + length * k,
y,
x + length * k,
y + height * number)
end
end
end
else
gc:drawLine(x, y, x + length * (number+1) - length, y )
gc:drawLine(x + length * number, y, x + length * number, y + height * number)
for k = 1, number do
for m = k, number do
gc:drawLine(x + length*(m-1), y + height * m, x + length * number, y + height * m)
gc:drawLine(x + length * (k-1), y, x + length * (k-1), y + height * k)
end
end
end
Home ← TI-Nspire Authoring ← TI-Nspire Scripting HQ ← Scripting Tutorial - Lesson 9
