Home ← TI-Nspire Authoring ← Create Your Own TI-Nspire Tiles
Create Your Own TI-Nspire Tiles
Draggable tiles can be a very useful tool in creating interactive TI-Nspire documents. The earliest examples involved algebra tiles - drag the prepared tiles (x2, x and unit (1)) tiles onto the "mat" and build an algebraic expression or equation. Tiles can also be used for students to drag the answers to questions onto different positions, or for such purposes as dragging different genetic combinations into a table.
All involve the same principle: the tile is built around a draggable point, and the coordinates of this point, stored as variables, give the location of the tile. Depending on this location, different things happen.
For this example, we will construct a simple algebra tiles activity.
Step 1: Create the points
Create a new Graph page. Eventually, we will split the window into the Graph window and a Notes window, to display the expression which will be built. I like to turn on the grid and use menu > Points & Lines > Point On to give the movement of the points some restrictions: makes them easier to place for students.
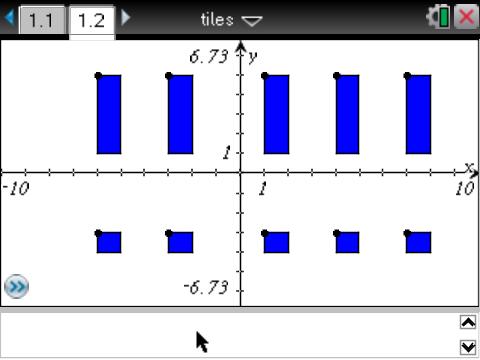
In our example, we will create 5 x-tiles and 5 unit tiles. You can go back later and create more of these (and create some x-squared tiles as well): 10 of each is a good working number. You will also need some negatives, eventually.
So begin by dropping 5 points for our x-tiles and another 5 for our units.
We will also need values for x, and for our unit, 1. The 1 is easy: Just use the text tool to drop a number one on any white space (you will need to avoid right-clicking on the grid). We could do the same for our x-value - just type something like 4 (later, we will want this to be controllable, but for now we will just set it as 4).
Finally, we will display the coordinates of each point and store these: I use something simple like (x1,y1), (x2,y2) for the x-tiles; (ux1,uy1),(ux2,uy2) for the units. Right click on each point and choose Coordinates & Equations. The right click on each coordinate and store it. Then hide each ordered pair.
Step 2: Building the Tiles
We are now ready to build our tiles. To remove distractions, we can also hide the grid at this point - it is no longer needed.
Choose menu > Shapes > Circle and click on one of our text values (1 or 4). This sets the radius of our first circle. Click on the first of our points to place the circle. Repeat for the other value.
Choose menu > Constructions > Perpendicular and click once on one of the axes, and then on the centre point. Since this is to be an x-tile, it will be 1 unit wide and 4 unit high. Set up perpendiculars for this, and then choose menu > Shapes > Polygon and click on the four corner points to define our x-tile.
Repeat this process for the first unit tile - simpler since it needs only the one value. Now hide all unnecessary constructions, leaving just the control point and the polygon. I colour my tiles to make them more visible.
Once these "master" tiles have been created we are able to duplicate these using Translation from the Transformations menu. Just choose this option, click once on the polygon, then on the control point, then click on the next point for a new tile. The original will be translated onto this new control point. repeat this for all the points. You will then need to hide ALL FOUR corner points on each new tile, leaving again just the polygon and control point.
To quickly colour all tiles, multiple select all by just clicking on each and then right-click and choose Color.
Step 3: Tracking the Tiles
Now the fun part!
We will write a program that will run in the background in a hidden Notes window. It will monitor each tiles position.
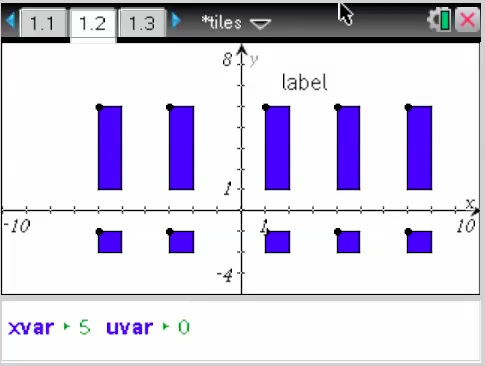
For this document, we will create two variables: xvar and uvar which will keep count of the number of each tile type that lies above the x-axis. As we drag an x-tile above the x-axis, xvar will increase by 1. Drag it back below the axis and it will decrease by 1. Simple.
The first stage of the program, we will call "tiles", is as follows:
Define tiles()=
Prgm
:xvar:=0
:uvar:=0
:If y1>0 Then
:xvar:=xvar+1
:EndIf
:If uy1>0 Then
:uvar:=uvar+1
:EndIf
:
:EndPrgm
To finish this program, we could simply copy and past 5 times, and set it to monitor all five of each tile.
There is, however, a more powerful way. It uses a programming technique called "indirection". The name describes referring to variables INdirectly, rather than directly. Remember that the command "expr()" turns a string into a mathematical expression (if valid). Study the following and consider what is happening:
Define tiles(y1,y2,y3,y4,y5,uy1,uy2,uy3,uy4,uy5)=
Prgm
:Local k
:xvar:=0
:uvar:=0
:For k,1,5
:If expr("y"&string(k)&">0") Then
:xvar:=xvar+1
:EndIf
:If expr("uy"&string(k)&">0") Then
:uvar:=uvar+1
:EndIf
:EndFor
:
:EndPrgm
Note here, not only the use of the "expr" command to allow us to generalise the program without having to repeat each If..Then..Endif statement 5 times. Note also the use of the variables as inputs: changes to these trigger the program and so it reflects changes made in the graph screen.
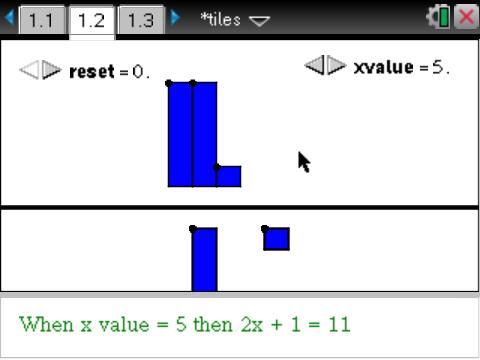
All that remains, really, would be a nice "reset" command. So Insert a slider, call it reset, and have it run from 0 to 1. When reset=1 we want all our tiles in position below the x-axis. Suppose we place all our x-tiles at (-2,-1) and all our unit tiles at (1,1). Create a new program, call it "resetter" with reset as its argument.
Define resetter(reset)=
Prgm
:
:Local k
:If reset=1 Then
:For k,1,5
:expr("x"&string(k)&":=-2")
:expr("y"&string(k)&":=-1")
:expr("ux"&string(k)&":=1")
:expr("uy"&string(k)&":=-1")
:EndFor
:EndIf
:
:EndPrgm
Run this also in the hidden Notes window and you are ready to go!
Finally, in our original "Tile" program, create an expression to display under our algebra tiles window that reflects the algebraic expression being built.
ex:=string(xvar)&"x+"&string(uvar)
You can even use that value for x that we set up at the start. Use Hide/Show to reveal it and store it as, say, "value". Then insert a slider called xvalue and you can now control the size of our tiles. Add the following to make our dynamic text even more useful:
ex:="When x value = "&string(approxRational(xvalue))&" then "&string(xvar)&"x + "&string(uvar)&" = "&string(approxRational(xvar*xvalue+uvar))
And you are done!
Some Challenges
Think about how you might add negative x and unit terms. How might you automate the setting up of the tiles? Dragging on the handheld can be slow - it would be nice (even just for the teacher) to be able to enter the equation and have this set up automatically - but how could this be accomplished? (For answers, refer to the download files at the top of the page).
©2009 Compass Learning Technologies ←Home ← TI-Nspire Authoring ← Create Your Own Tiles