Home ← TI-Nspire Authoring ← Dynamic Models with Scatter Plots and Interactive Notes
Dynamic Models for Mathematics: sampler
Dynamic Models for Science: sampler
Dynamic Models with Scatter Plots
Dynamic Scatter Plots have always been possible in TI-Nspire, since the Lists & Spreadsheet application has always been "live" - by linking lists in the spreadsheet to variables, such as a slider, those lists could be updated and changed as the value of the slider variable changed. The big change that came with TI-Nspire 2.0 was the introduction of Interactive Notes, another live environment just like the spreadsheet, but one which could also run programs.
One of the key differences between functions (which can run almost anywhere in TI-Nspire, including the spreadsheet) and programs (which can only be run in the Calculator and, in a more limited way, in Notes) is the ability for a program to define and change global variables. A function can leave no trace - it cannot define new variables, nor change existing ones - it can only return some output, such as a number, some text or a list or matrix (a single object).
The program, on the other hand, can define new variables and change existing ones. This makes a program running live in Notes a very powerful device for controlling all sorts of things, including lists which are displayed as scatter plots. The limitation of running programs in Notes is that "intermediate steps" are not displayed. In the calculator, a program (and a function) can display lines of text. A program in the Calculator can also use floating dialog boxes. These do not work in Notes. However, the program itself runs just fine, and any changes that it makes are relayed through dynamically.
If all of this sounds very confusing, don't worry. Look at the mathematics and science samples and get a feel for some of the many, many ways in which we can use dynamic scatter plots and interactive notes to create exciting interactive documents of all sorts. When you feel ready, have a look at the programs that create these scatterplots and begin to play with some of your own. The program builds lists for the x and y coordinates of the scatter plots, often in quite complex ways. Probably the most useful tool in your toolbox for this work is the "augment" command, which takes an existing list (say, xlist) and adds some new list elements to it. For example, a very simple program:

Define test()
Prgm
Local k
xlist:={}
for k,1,10
xlist:=augment(xlist,{k})
endforEndPrgm
Try this little program: create it using the program editor, then run it in either Calculator or Notes. Nothing seems to happen, but then type "xlist" and you will see that it has created a list of numbers from 1 to 10. Sure there are easier ways to do that - but think of the possibilities!
Want to know more about programming for Dynamic Scatter Plots? Visit the Scatter Plots Tutorial page.
Dynamic Models with Strings
If lists are the tools that drive dynamic scatterplot models, then strings are what make the magic happen with Notes!
Quite simply, a string is anything that is found between "quotes". To make models that are dynamic and interactive, you need to know two things: how to glue strings together, and how to break them apart.
The first is easy: to glue two strings together, simply use the "&" symbol. So to turn the strings "Steve" and "Arnold" into a single object, you would enter "Steve"&"Arnold" and you would get "SteveArnold". Clearly a space would be useful here, but you must wonder what this actually achieves?
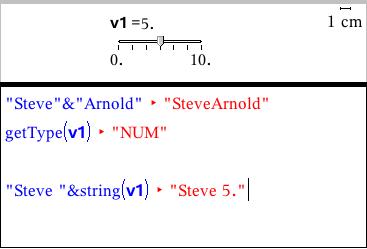
Create a new page and split it horizontally so that the top half is a Geometry window, and the bottom a Notes window. In the top, insert a slider (just accept the default name "v1" and drop it anywhere convenient). In the Notes window, insert a MathBox (ctrl-m) and enter a string, such as "Steve ". Press enter and the string will be output.
Now the variable "v1" that was created and driven by the slider is available in all applications within this problem - but it is NOT a string: it is clearly a number. In fact, if you type getType(v1) in a new MathBox, the output should be "NUM". To turn it into a string, we use the "string(" command.
So in your first MathBox, change the input from "Steve " to "Steve "&string(v1), and press enter. Now drag the slider and watch your first example of a dynamic string!
Want to know more about programming Strings for dynamic models? Visit the Dynamic Strings Tutorial page.
©2010 Compass Learning Technologies ←Home ← TI-Nspire Authoring ← Dynamic Models with Scatter Plots and Interactive Notes