A4 Paper Folding


Fold a piece of A4 paper as shown. (Note that A4 paper is 29.7 x 21 cm)

Explore the relationship between the position of the fold (OP) and the area of the triangle formed.

When is this area greatest?


Before beginning the assessment task, you should activate the GeoGebra CAS engine - press the Activate CAS button which follows until you get a correct result. It may take a couple of attempts. Then commence the task.


Back to Top


Assessment

Be sure you have activated CAS before you begin.

Hint: When entering mathematical expressions in the math boxes below, use the space key to step out of fractions, powers, etc. On Android, begin entry by pressing Enter.

Type simple mathematical expressions and equations as you would normally enter these: for example, "x^2[space]-4x+3", and "2/3[space]". For more interesting elements, use Latex notation (prefix commands such as "sqrt" and "nthroot3" with a backslash (\)): for example: "\sqrt(2)[space][space]". More?


1. Drag the point P to find the height value for which the area of the triangle is greatest.


Jump to GeoGebra


2. Build an algebraic model for the area of the triangle by defining the following functions: height(x) =


Jump to GeoGebra


3. hypot(x) =


Jump to GeoGebra


4. base(x) =


Jump to GeoGebra


5. area(x) =


Jump to GeoGebra


6. Using Calculus build the derivative function for area(x) and use this to find the exact value of the height for which the area of the triangle is greatest: myderiv(x) =


Jump to GeoGebra


7. myderiv(x) = 0 when x =


Jump to GeoGebra


How difficult did you find this activity? Please assign a rating value from 1 (very easy) to 5 (extremely difficult). Comments? Suggestions? What did you learn from this activity?


Jump to GeoGebra


My name:

My class:

Teacher Email:

Scan me!
Send to Cloud

Back to Top

Back to Top

Peter Fox and Steve Arnold. Created with GeoGebra


This problem may also be modelled using CabriJr on the TI-83/84 series calculator. Click on the graphic below to download the file and try it yourself!

Try having students work in pairs: one generating data points using the CabriJr model and the partner entering these into lists to plot and then to help build their algebraic model!

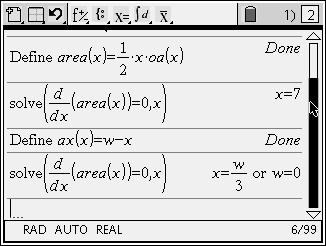
And just wait until you try this with TI-nspire CAS!


This dynamic figure was created using the latest version of the free GXWeb from Saltire Software, as shown below.

Back to Top


©2019 Compass Learning TechnologiesLive Mathematics on the Web GeoGebra Showcase ← The Paper Fold Problem