Home ← TI-Nspire Authoring ← Create Your Own TI-Nspire Dynamic Tables
Create Your Own TI-Nspire Dynamic Tables
Some will tell you that you cannot "do" tables in Notes. This tutorial proves that is simply not true. In fact, there are a couple of neat options that will not only deliver static tables, but will allow you to create dynamic tables. These can have live content, and you will also be able to control the viewable window, and scroll through the table while remaining in the visible window.
Two main techniques will be covered here: the first for simple tables of just one or two columns; the second uses matrices to support multiple columns.
Method 1: Line Breaks within a MathBox
Simple tables can be created by inserting line breaks within the Notes MathBox, but this cannot be done outside of a program. The technique is very simple: create a local variable called "br" defined using a quotes string with a carriage return inside. Then simply use this between lines of text.
For our first example, we will use a draggable point in a Graphs window, with coordinates stored as x1 and y1.
Create a new program, called, say, "monitor" as follows:
Define monitor(x1,y1)=
Prgm
Local br
br:="
"
ex:="x-coordinate = "&string(x1)&br&"y-coordinate = "&string(y1)
EndPrgm

Obviously, this is a very simple example, but it easily leads to more interesting things. Under TI-Nspire 3.0, those annoying "quotes" around the text disappear, so we get a very nicely presented result.
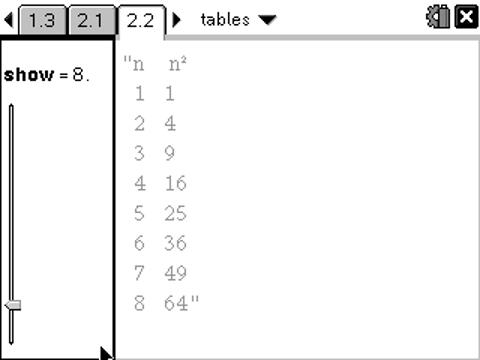
Now for something a little more interesting. This time we will create a table with, say 50 rows, displaying the values of the squares of the counting numbers. For our layout, we will split the screen vertically, with a Geometry window and slider on the left and our Notes window on the right. For a simple slider window, Geometry is better than Graphs, since you don't have to worry about the Function Entry Line popping up; the only thing to hide on a Geometry window is the Scale (go to menu > View > Show/Hide Scale).
For this we will use a "For..EndFor" loop. Begin by defining our line break, and then define the first line of our table (here we will use a header like "n n2") (Get the superscript 2 from the Symbols Palette!). The program will look like:
Define squares(show)=
Prgm
Local br,k
br:="
"
ex:="n n2"
For k,1,show
ex:=ex&br&string(k)&" "&string(k^(2))
EndFor
EndPrgm

This works pretty well, but scrolling down the Notes page is less than effective. Wouldn't it be better if the table scrolled instead?
Method 1.2: Scrolling Tables
For our table to scroll, we first need to decide how many lines we want in our viewable window. generally, for the handheld, 9 or 10 lines fits quite nicely. For the computer view, it will vary depending on all sorts of factors, like screen resolution, size of window. We will set up here for the standard handheld viewing screen; if you really want to optimise for a more general case, then another slider could be added, which controls the number of tables lines to be displayed.
There are two situations to consider: if the number of lines in the table is less than or equal to our viewing span (10 lines for this example), and times when the number of lines in the table exceeds our span. Since we have a header line, we will use 9 lines for our display.
We simply add the following condition:
If show<=9 Then
For k,1,show
ex:=ex&br&string(k)&" "&string(k^(2))
EndFor
Else
For k,show-9,show
ex:=ex&br&string(k)&" "&string(k^(2))
EndFor
EndIf

Method 2: Scrolling Matrices
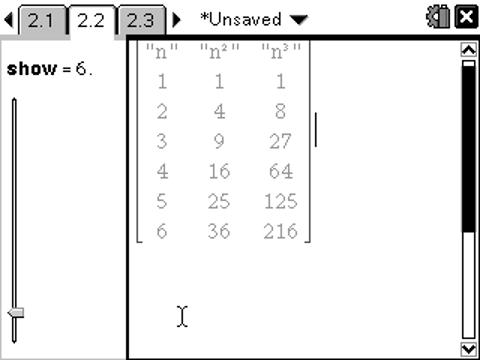
Now the method above works just fine for one or two columns, but more than that and the layout quickly gets messy. For such cases, a matrix organizes the cells neatly and presents them well. The only downside: while the quotes have been banished from text in MathBoxes, the quotes still remain when the text is in a list or a matrix. But this seems a small price to pay for the ability to present information in tabular form.
Instead of strings, this method makes use of lists, which can then be easily converted into a matrix. To build the lists, we use the augment command, and then to turn a list "ex" into a matrix with, say 3 columns, use the List>Matrix command from the Catalog: List>Matrix(ex,3) will count every 3 list elements and turn these into a row of the new matrix.
Define table_matrix(show)=
Prgm
Local k
ex:={"n",_,"n2",_,"n3"}
If show<=9 Then
For k,1,show
ex:=augment(ex,{k,_,k^(2),_,k^(3)})
EndFor
Else
For k,show-9,show
ex:=augment(ex,{k,_,k^(2),_,k^(3)})
EndFor
EndIf
ex:=list>mat(ex,3)
EndPrgm

Challenge: Can you see how we might control the height of the display, from a fixed value of 9 or 10 to a more general value? This will be important if you wish to use your tables document on more than just a handheld - including, with TI-Nspire 3.0, the new PublishView.
Extension: A nice next step for this activity is to create a general template document that makes it easy to create a table from any data you like. Interested?
