Home ← TI-Nspire Authoring ← Create Your Own TI-Nspire Dynamic Hundreds Chart
Create Your Own TI-Nspire Dynamic Hundreds Chart
A nice application of the dynamic text capabilities available within the Notes application of TI-Nspire is this dynamic hundreds chart. Display the numbers from 1 to 100 in a 10 x 10 table. Drag a slider to change factors from 1 to 50. When n = 2, the chart displays all the factors of 2; when n = 3, the factors of 3 are displayed.
This document uses a small program to create a 10 x 10 matrix which is dynamically linked to the slider variable n.
Step 1: Set up your document
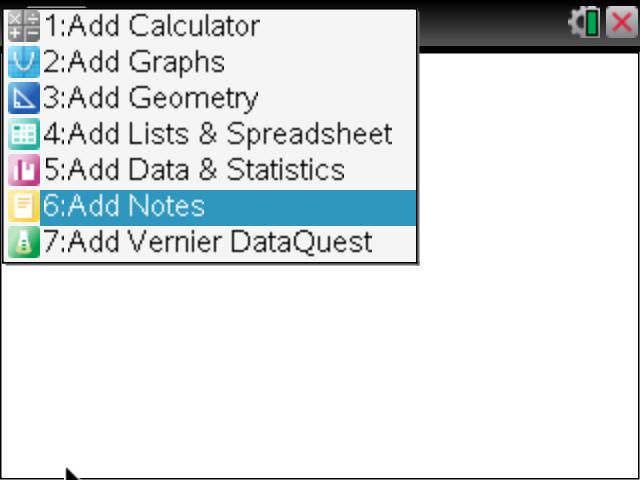
Begin a new document with a Notes page to serve as a title page (and also to hide the live program running everything else). Use Doc > Page Layout > Select Layout > Layout 3 to split the page horizontally. Make the new window also a Notes window. We will come back to this later.
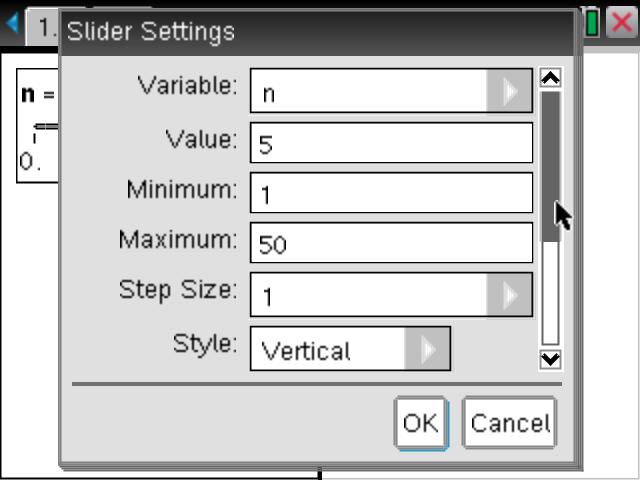
Insert a new page (ctrl-Doc) and split this page vertically, as shown. Choose a Geometry application for the left window (this will house the slider for the variable n) and choose a Notes page for the right. Insert a slider into the Geometry window and right-click (ctrl-menu on the handheld) to access the Settings. Adjust these as shown.
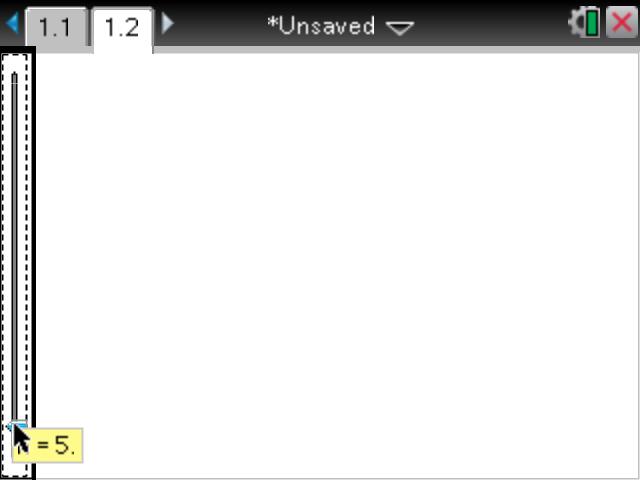
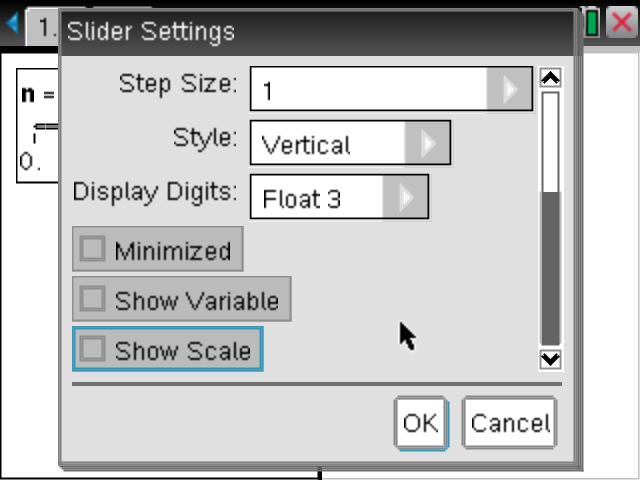
Finally, use Doc >Page Layout>Custom Split to change the proportion of the windows - maximise the Notes and make the Geometry window as thin as possible. This will result in a layout as shown.
Now we are ready to write the small program that will make the magic happen!
Step 2: Writing the Hundreds Program
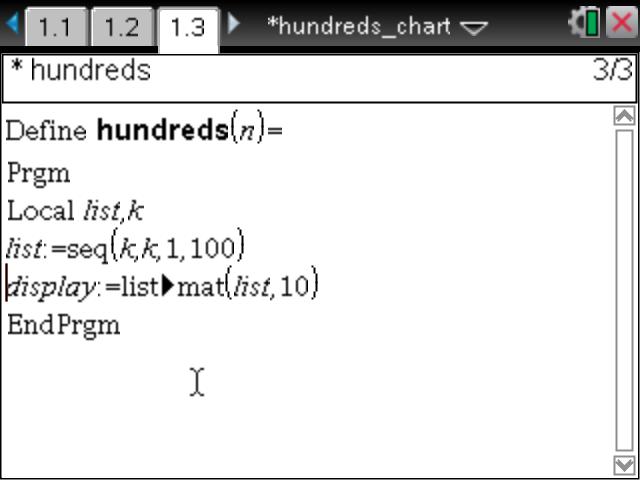
Insert a new page, then use Doc>Insert>Program Editor>New to create a new program. Call it hundreds and press OK.
It is generally good practise to begin by defining variables as Local, so that they do not "survive" the running of the program and stay around and clutter things up! So begin by defining a variable k as Local (menu>Define Variables>Local).
We will begin by defining a list of numbers from 1 to 100: list := Seq(k,k,1,100)
We now use a neat command from the Catalog called List>Matrix which converts that list into a 10 column matrix which we will call display: display := List>Matrix(list, 10)
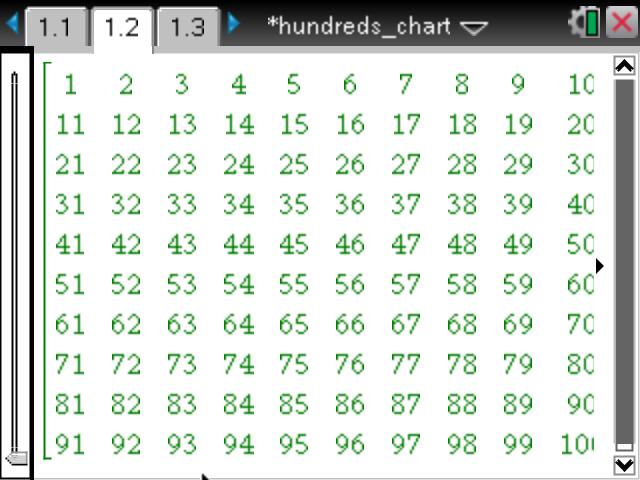
Press ctrl-b to Check Syntax and Store this program. Go back to your Notes window on the previous page. Press ctrl-m to Insert a MathBox: type display and press enter. You should see your 10x10 hundreds chart.
Right-click (ctrl-menu on the handheld) anywhere in the MathBox and choose MathBox Attributes. Change the first drop-down menu from Show Input and Output to Hide Input. Press enter. Now if you press ESC to exit the MathBox, you will see the display disappear and be left with just the 10x10 matrix.
Change the value of the slider - nothing happens because we have not yet told it to do anything.
Now for the fun part! First a lesson about lists. If you insert a Calculator window, and define a list such as list1:={1,4,9,16,25}. Now type list1[3] and press enter. What you get is the third element of list1. So a list name followed by brackets with a number gives that term of the list.
The second ingredient we need is a test to see if a number is divisible by n. There are several ways to do this, but one of the nicest uses the mod function: In the Calculator, type mod(5,2) and see that you get 3. In other words, what is the remainder when 5 is divided by 2?
We can now make our program dynamic using an If..Then..Else..EndIf

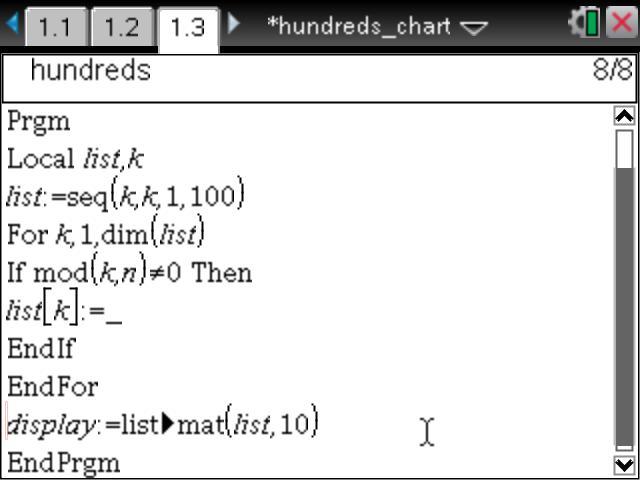
Create a For..EndFor loop to run a dummy variable (say, k) from 1 to 100. If k is divisible by n then make no shape. If not, then suppress the display by showing the underscore (the void in TI-Nspire). (Get the "not equal to" symbol from the Symbols Palette or on the handheld, press ctrl-=). See this on the screenshot.
Now when you change the value of the slider n the hundreds chart will display all the multiples of n and students can observe the patterns for different values.

